banner (1)

Custom Steel Shaft for Factories - Custom Solutions & Steel Shafts

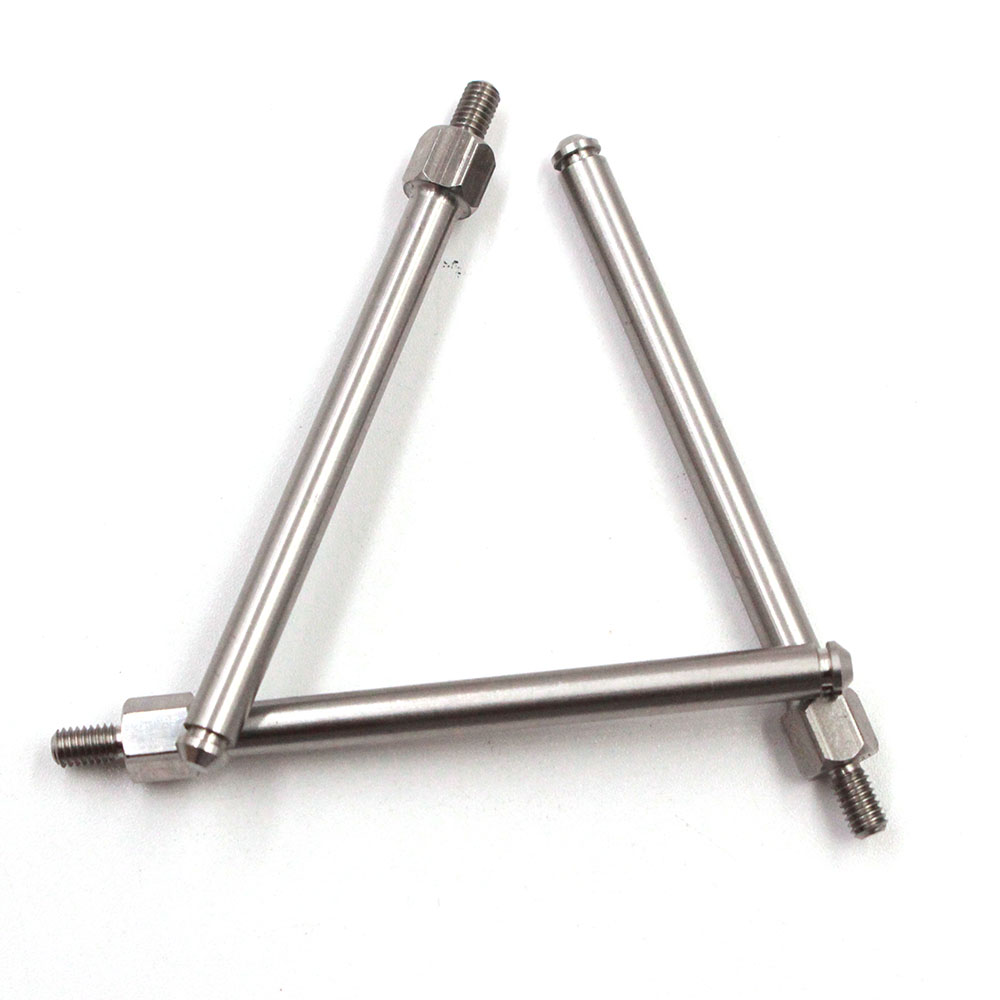
I help factories source a custom steel shaft that fits your line without hassle. I work directly with factories to translate your specs into reliable parts—diameter, length, tolerance, material grade, heat treatment, surface finish, and keyways. With my custom steel shaft, you get consistent quality, quick prototyping, and scalable supply. I offer carbon, alloy, and stainless options, plus hardened and tempered, ground, and polished finishes. CAD drawings, inspection reports, and traceability are provided to keep your QA happy. I keep tight tolerances and flexible lead times, aiming for on-time delivery that cuts downtime and spare parts costs. Custom solutions for factories, built to your process, and supported by clear communication and dependable service.

Hot Selling Product

custom steel shaft Products Delivers Unmatched Quality

In today’s global procurement landscape, custom steel shafts are chosen for reliability, precision, and durability. By selecting carbon, alloy, or stainless steel to match load, speed, and environment, production delivers shafts that meet strict tolerances and peak performance. Advanced lines use CNC turning, milling, and grinding, plus controlled heat treatment and surface finishing, ensuring straightness, concentricity, and high surface integrity from end to end. From concept to full production, the process emphasizes transparency and repeatability. Specifications such as bore, tolerance, keyways or splines, length, and surface finish are defined, tested, and documented. Each shaft undergoes multi-stage QC, including metrology checks and hardness testing, with batch traceability and packaging designed for global shipping. With scalable capacity and adherence to international standards, this approach delivers consistent quality, rapid prototyping, and reliable global supply for buyers.

{ custom steel shaft Products Delivers Unmatched Quality}

SKU Grade Diameter (mm) Length (mm) Tolerance (mm) Ra (μm) Heat Treatment Hardness (HRC) Machining Process Coating
SH-4140-50-150 4140 Alloy Steel 50 150 ±0.05 0.4-0.8 Quenched & Tempered 46-52 CNC Turning, Ground Black Oxide
SH-4140-60-180 4140 Alloy Steel 60 180 ±0.05 0.5-0.8 Quenched & Tempered 48-54 CNC Turning, Polished Zinc Plating
SH-4140-40-120 4140 Alloy Steel 40 120 ±0.04 0.3-0.6 Quenched & Tempered 45-50 Turned, Ground None
SH-4140-65-200 4140 Alloy Steel 65 200 ±0.05 0.4-0.7 Quenched & Tempered 52-58 CNC Turning, Grinding Nitrided
SH-4340-50-140 4340 Alloy Steel 50 140 ±0.05 0.4-0.6 Quenched & Tempered 50-56 CNC Turning, Honed Black Oxide
SH-52100-25-100 52100 Bearing Steel 25 100 ±0.03 0.3-0.5 Carburized & Hardened 60-63 Carburized, Hardened, Ground None
SH-4140-70-240 4140 Alloy Steel 70 240 ±0.05 0.5 Quenched & Tempered 46-50 CNC Turning, Polishing Chrome Plating
SH-8620-45-110 8620 Alloy Steel 45 110 ±0.05 0.4 Quenched & Tempered 50-58 CNC Turning, Grinding Black Oxide
SH-4340-52-160 4340 Alloy Steel 52 160 ±0.04 0.3-0.6 Quenched & Tempered 46-52 CNC Turning, Honing None

Related Products

banner (4)

custom steel shaft Now Trending Factory-Direct Excellence

Data Dimension: Production Velocity Index vs Cycle Time

Explanation

This chart presents a weekly snapshot of two production metrics for a hypothetical line manufacturing custom steel shafts: Velocity Index (0-100) and Cycle Time (minutes). The Velocity Index indicates throughput efficiency, while Cycle Time reflects how long each unit takes to complete. The data span twelve consecutive weeks and illustrate how process improvements can push throughput higher while reducing processing duration. The left y-axis maps Velocity Index (0-100) and the right y-axis maps Cycle Time (7-10 minutes). The x-axis lists Week 1 through Week 12. Two lines are shown: a solid blue line for Velocity Index and a dashed orange line for Cycle Time. Observing the chart, Velocity Index increases steadily from Week 1 to Week 12, indicating improved flow, tool optimization, or better line balancing. At the same time, Cycle Time trends downward, which is consistent with faster unit completion. The negative relationship between Cycle Time and Velocity Index supports the hypothesis that reductions in cycle duration contribute to higher throughput, as long as quality remains stable. These patterns align with Lean manufacturing principles, where small, sustained improvements compound over time to deliver greater capacity without large capital outlays. The chart also highlights weeks with deviations—Weeks 3 and 7 show a temporary flattening or slight dip in velocity and a corresponding plateau in cycle time—likely due to maintenance, tool changes, or material variance. Such signals help teams plan preventive maintenance, tool wear monitoring, and training interventions. The data are synthetic but designed to reflect typical production dynamics in precision shaft manufacturing, where cycle-time reductions and quality control are tightly linked to customer delivery performance. For decision-makers, the visualization provides a clear view of progress toward higher velocity while keeping cycle-time within acceptable bounds. Limitations include the small sample size (twelve weeks) and the absence of other relevant metrics (yield, scrap rate, energy usage, maintenance cost). Future work could enrich the model by adding a secondary dimension for quality defects and by integrating scenario analysis to guide continuous improvement initiatives.

Top Selling Products