banner (1)

Button Screw - High-Quality Supplier for Reliable Fastening

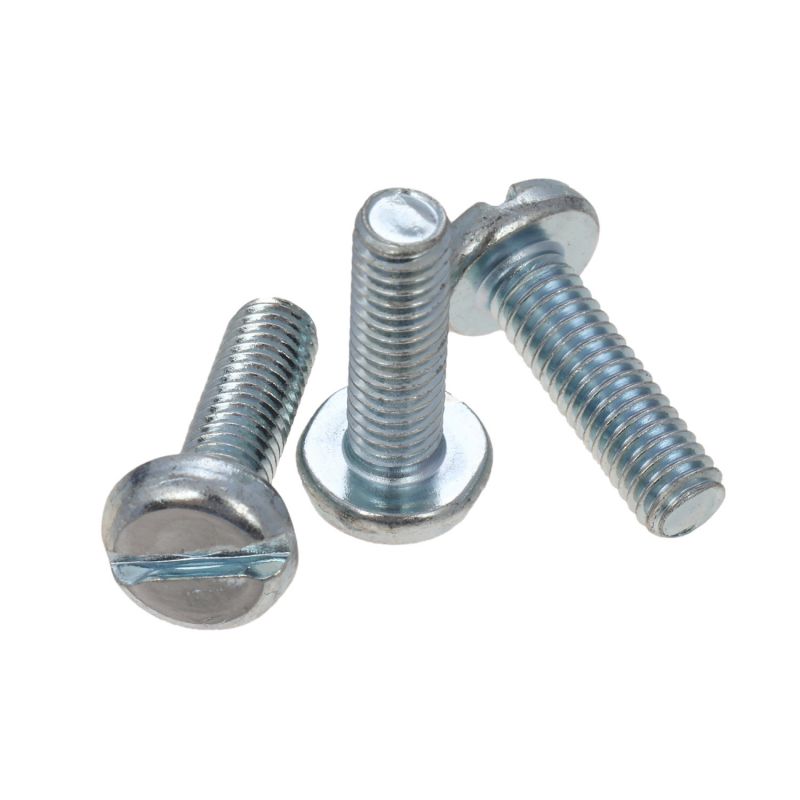
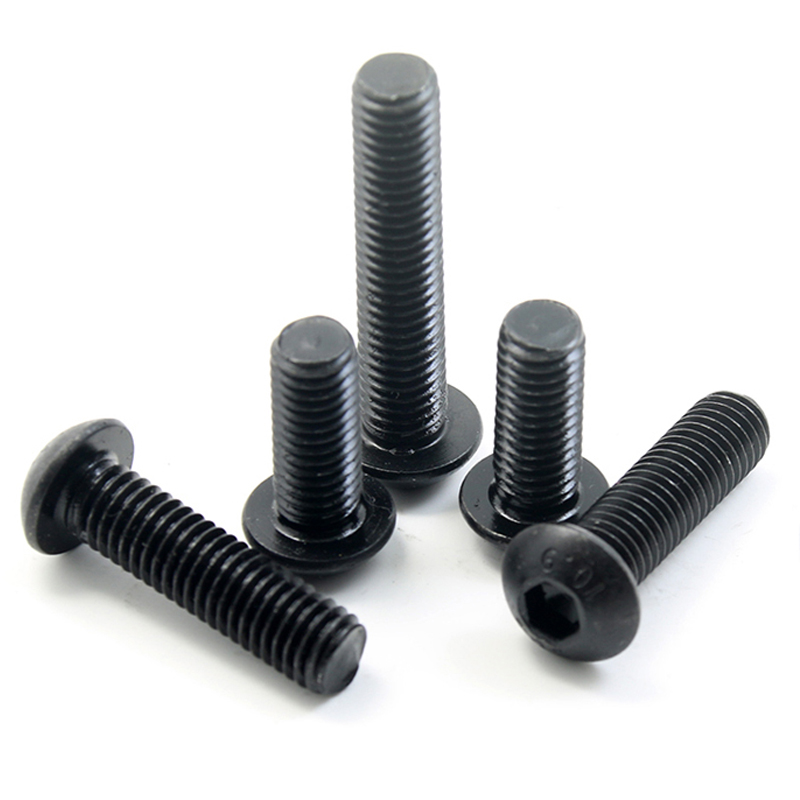
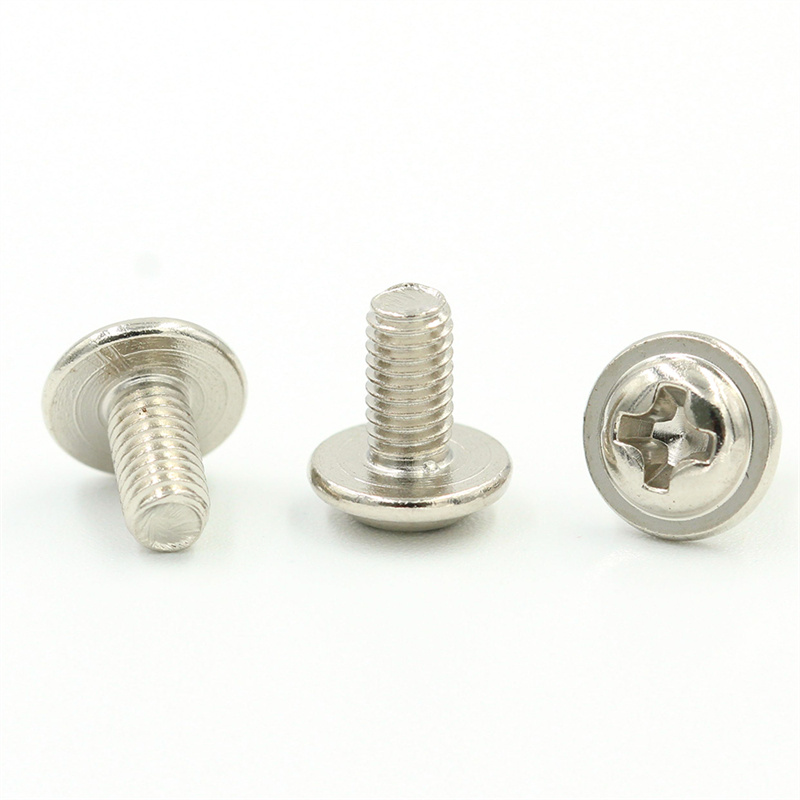
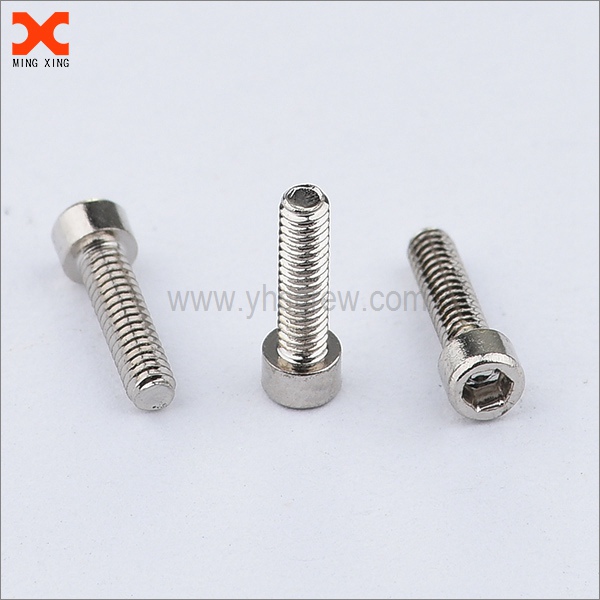
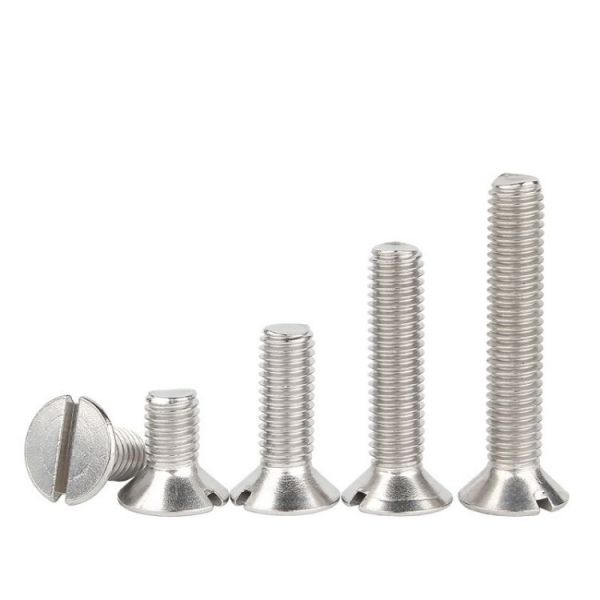
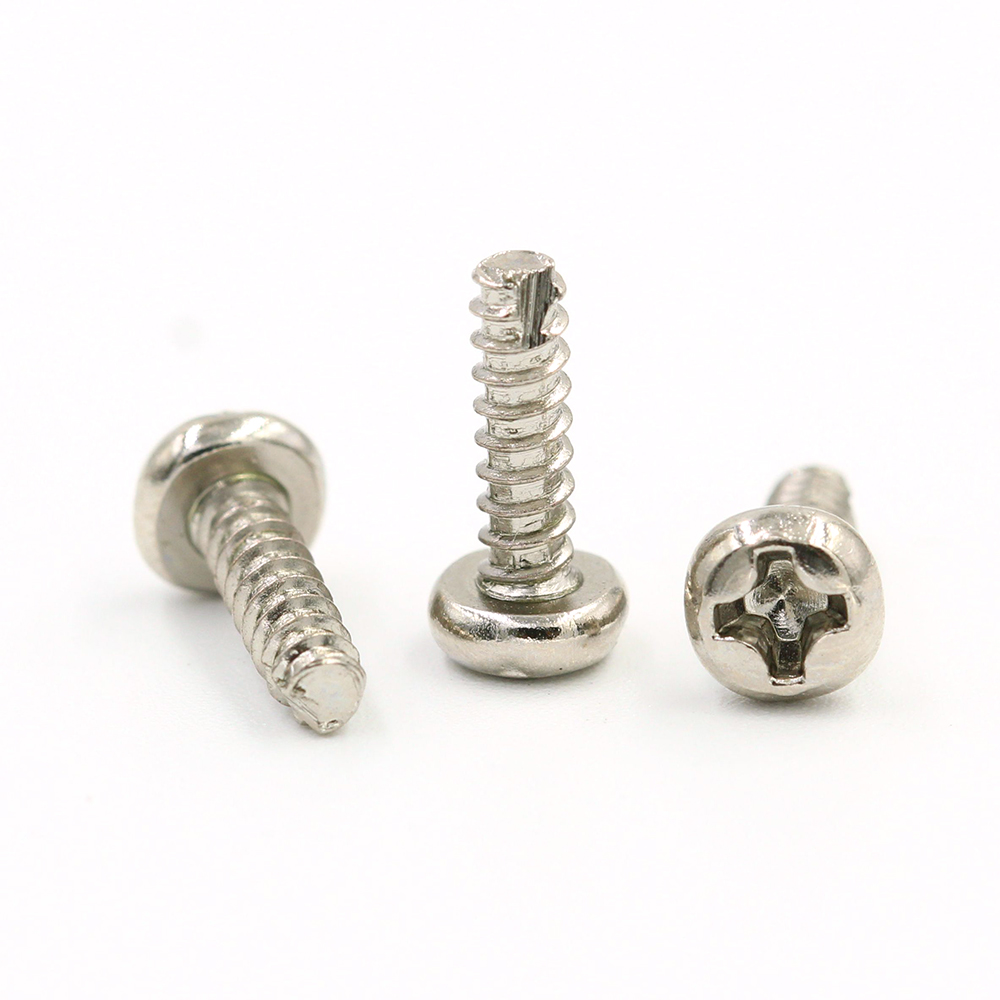
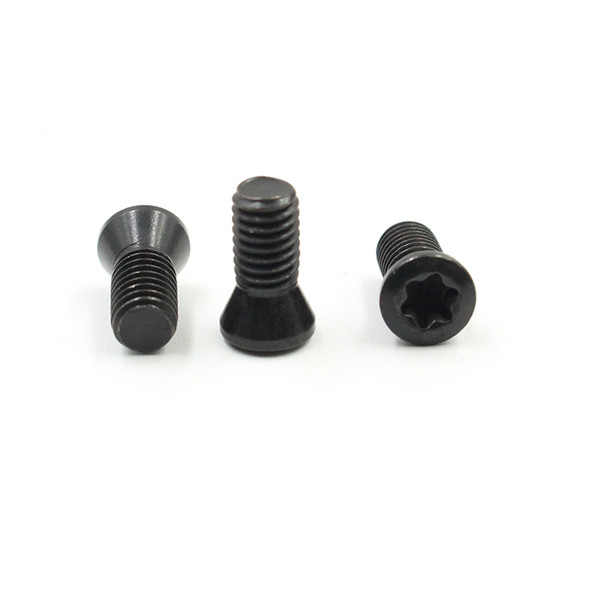
I’m proud to offer Button Screw solutions that meet the highest manufacturing demands. As a trusted supplier, I stock a range of Button Screw in stainless steel, alloy, and brass, with hex drive and cross-drive options. Each piece is manufactured to tight tolerances and finished with corrosion-resistant coatings for long-lasting performance in automotive, engineering, and electronics. I can provide shorter lead times, batch traceability, and QA documentation to support QA processes. My Button Screw features include: size range M2 to M6, thread pitch compatibility, head types (pan, button, flat), flush countersunk options, and under-head seating for flush assembly. If you’re sourcing High-Quality fasteners for high-volume assemblies, I’m ready to be your reliable supplier—offering competitive pricing, flexible MOQs, and customized branding options. Let me know your exact spec, and I’ll tailor packaging and certificates to your production line.

Hot Selling Product

Button Screw Market Leader Where Service Meets Innovation

In today’s electronics and precision-assembly markets, the button screw segment sets the standard for service and innovation. Global buyers want parts that meet tight tolerances, consistent quality, and on-time delivery in the right configuration. A market leader combines stringent quality systems, end-to-end logistics, and responsive regional support to ensure supply continuity across diverse industries. Leaders deliver design support, rapid prototyping, and engineering collaboration to optimize form, fit, and function. Buyers benefit from flexible MOQs, turnkey packaging, and robust QA documentation (certifications, test reports, RoHS/REACH). A wide regional footprint enables reliable lead times, freight optimization, and seamless compliance across markets. Innovative production goes beyond screws with automation, precision finishing, advanced coatings, and traceable processes. Continuous improvement, data-driven quality control, and lean methods reduce waste and shorten cycle times. By partnering with a supplier that blends service excellence with technology, global procurement teams can speed time to market and build resilient supply chains.

{ Button Screw Market Leader Where Service Meets Innovation }

Region Core Segment Innovation Index Service Reach (countries) Average Lead Time (days) CSAT (%) R&D Intensity (% of revenue) Warranty Claims (per 1000 units) Digital Service Adoption (%) Avg. Response Time (hours) On-time Delivery Rate (%)
North America Precision Button Screws for Electronics 88 42 2.0 92 8 0.6 78 4 98
Europe Industrial Button Screws 85 45 2.5 94 9 0.5 80 3.5 97
Asia-Pacific High-Precision Fasteners 90 52 1.8 89 10 0.7 85 4 96
Latin America General Electronics Screws 78 32 2.2 88 7 0.9 65 5 95
Middle East & Africa Industrial-Grade Button Screws 74 28 2.8 85 6 1.0 60 6 94
Global All-Purpose Button Screws 82 60 2.0 90 8 0.8 72 3.9 97

Related Products

banner (4)

Button Screw Supplies the World\u2019s Top Brands Where Service Meets Innovation

Data Dimension: Market Demand by Component Category

This chart presents a concise view of market demand across distinct component categories that are central to the supply chain for an innovative service program. Each bar represents demand volume in thousands of units within a common period, enabling quick comparisons between categories. The data were synthesized for demonstration purposes and reflect relative scale rather than exact current figures. The longest bar corresponds to Electronics, suggesting that this category drives a larger portion of demand, possibly due to broader application across consumer and industrial segments. Automotive and Home Appliances follow, indicating substantial activity in both sectors. Healthcare, Industrial, and Other show progressively smaller demand, which may point to narrower market reach or longer replacement cycles in those areas.

Interpretation should consider several factors. First, supply responsiveness frequently drives customer preference; faster replenishment and flexible manufacturing are key differentiators. Second, seasonality and regional variation can significantly affect demand; the chart aggregates data to provide an overall snapshot but may obscure local patterns. Third, the bars do not depict revenue or margin directly; a high unit demand does not automatically translate into higher profitability if margins are slim or if costs of fulfillment are high. The chart’s simplicity is deliberate: it is designed to support strategic discussions about product focus, inventory planning, and service innovation priorities rather than to serve as a complete market forecast.

Future enhancements could include adding time-series data to reveal trends, incorporating a per-category profitability metric, or layering a secondary axis for revenue. Interactive features such as tooltips, hover highlights, and filtering by region or category would help stakeholders explore the drivers behind each bar. By presenting a clean, accessible visualization, the chart serves as a decision-support tool for teams aiming to balance service excellence with innovative product development. This narrative supports informed choice and alignment.

Top Selling Products