banner (1)

Stainless Steel Machine Screws - High-Quality Supplier

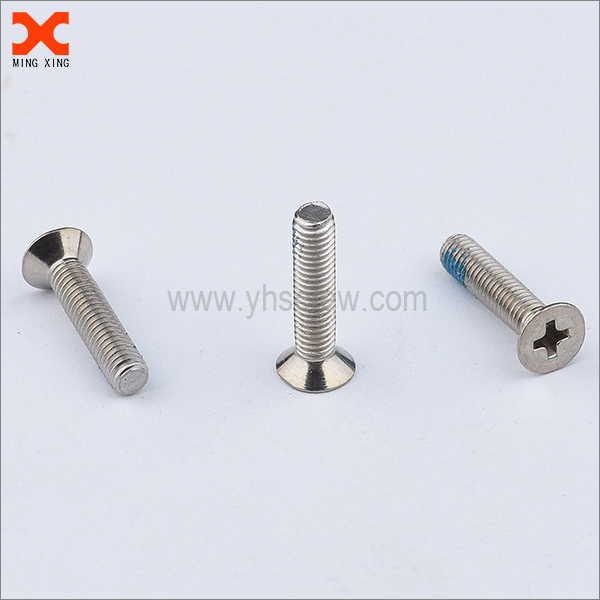
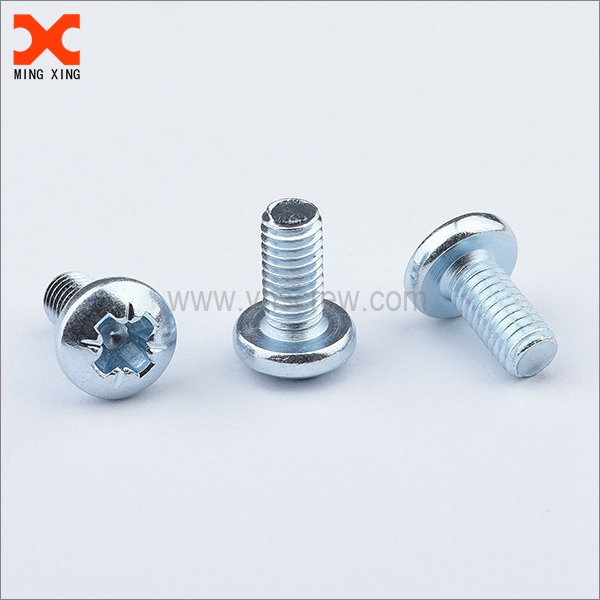
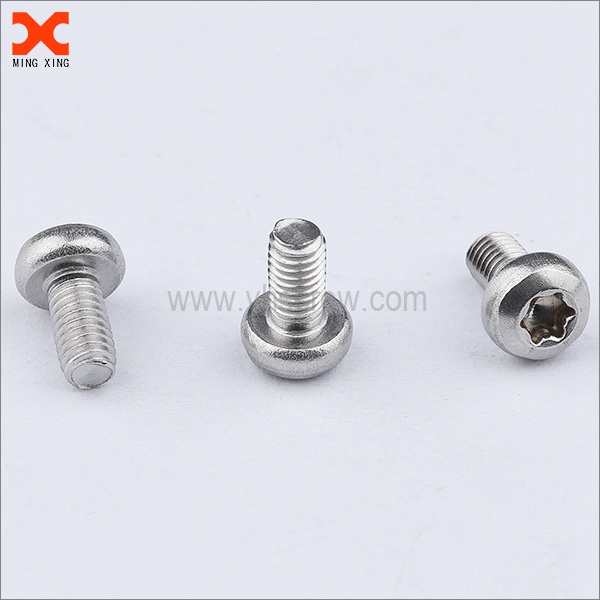
I’m your dedicated source for Stainless Steel Machine Screws, designed for reliability in harsh environments and critical assemblies. As a seasoned Supplier, I understand that B2B buyers need consistent quality, on-time delivery, and clear documentation. Our screws feature corrosion-resistant stainless steel, tightly controlled tolerances, and black-oxide or zinc-plated finishes as required. Whether you need Phillips, hex pan, or countersunk heads, I stock a wide range and can customize with thread length, diameter, and head style. I can provide heat-treating spec, chemical passivation, and traceability certificates to meet industry standards. Our packaging is bulk-friendly for assembly lines and procurement systems. I’ve built a reputation on delivering High-Quality fasteners that minimize downtime and maximize performance in machinery, electronics, automotive, and construction applications. If you’re sourcing a reliable Supplier of Stainless Steel Machine Screws, let’s talk about your exact specs, lead times, and bulk pricing.

Hot Selling Product

Stainless Steel Machine Screws Supplies the World\u2019s Top Brands Manufacturers You Can Rely On

Global buyers seek stainless steel machine screws that combine precision with durability. These fasteners deliver corrosion resistance, dimensional stability, and secure fastening across automotive, electronics, and construction. Sourcing from leading manufacturers helps ensure uniform thread forms, tight tolerances, and reliable drive options, with common grades such as 304/304L and 316/316L for varying environments. Finishes like zinc plating, black oxide, and passivation extend compatibility with different assemblies. Quality and predictability go hand in hand. Buyers can specify thread standards (UNC/UNF, metric), head styles, lengths, and tolerances to fit exact parts. Reputable producers implement rigorous QA from incoming inspection to final verification, backed by ISO and RoHS compliance. Transparent lead times and scalable production support enable just-in-time or bulk procurement, helping reduce downtime and ensuring consistent performance across global deployments.

{ Stainless Steel Machine Screws Supplies the World’s Top Brands Manufacturers You Can Rely On}
Nominal Diameter (mm) Length (mm) Thread Pitch (mm) Head Type Drive Type Material Grade Finish Strength Class Coating
3 8 0.5 Hex Socket Cap Screw Internal Hex (Allen) 2.5mm A2-70 (304) Passivated 8.8 None
4 12 0.7 Pan Head Phillips (PH2) A2-70 (304) Passivated 8.8 None
5 16 0.8 Hex Socket Cap Screw Internal Hex (Allen) 3.0 A4-80 (316) Passivated 10.9 None
6 20 1.0 Hex Socket Cap Screw Internal Hex (Allen) 4.0 A2-70 (304) Passivated 8.8 None
6 25 1.0 Pan Head Phillips (PH2) A4-80 (316) Passivated 8.8 None
8 30 1.25 Hex Socket Cap Screw Internal Hex (Allen) 5.0 A2-70 (304) Bright Passivated 8.8 None
8 45 1.25 Button Head Torx (T25) A4-80 (316) Polished 10.9 None
10 40 1.5 Flat Head (Countersunk) Internal Hex (Allen) 6.0 A2-70 (304) Passivated 8.8 None
12 60 1.75 Hex Socket Cap Screw Internal Hex (Allen) 8.0 A4-80 (316) Passivated 10.9 None
12 50 1.75 Pan Head Phillips PH3 A4-80 (316) Polished 8.8 None
3 50 0.5 Button Head Torx (T10) A2-70 (304) Passivated 8.8 None
5 25 0.8 Flat Head Allen (2.5) A4-80 (316) Polished 10.9 None

Related Products

banner (3)

Stainless Steel Machine Screws Factory Guarantees Peak Performance

数据维度标题:产能利用率分布(单位:百分比)

Capacity Utilization Distribution by Production Stage Stage A Stage B Stage C Stage D Stage E

New Data Title: Capacity Utilization Distribution by Production Stage

The chart above presents the distribution of capacity utilization across production stages in a stainless steel machine screws manufacturing line. Each bar quantifies the fraction of available processing time that was actually used during the measurement period, expressed as a percentage. Read collectively, the bars reveal patterning in resource use, highlight bottlenecks, and suggest where performance gains can be realized. A higher bar signals that a stage operated near its capacity, which can maximize throughput but may expose equipment and staff to higher wear and more frequent maintenance needs. A lower bar indicates underutilization, potentially caused by setup times, changeovers, material delays, or mismatches between demand and production scheduling. In this example, Stage B at 92% utilization demonstrates strong demand alignment and high productivity, while Stage C at 65% points to a potential bottleneck or inefficiency that warrants investigation. The distribution, therefore, provides a quick diagnostic tool for operations managers to prioritize improvement efforts, allocate maintenance resources, and adjust staffing. When interpreting the chart, it is important to consider not only the absolute percentages but also the volatility over time. A single snapshot may be misleading if significant downtime occurs during peak periods or if seasonal demand shifts are not captured. By integrating this chart with auxiliary data—such as cycle time, scrap rate, changeover duration, and downtime incidents—teams gain a richer understanding of where value is created and where it is lost. The ultimate goal is to align capacity with demand while maintaining product quality and safety. Target utilization in many manufacturing settings tends to lie in a tight band, often around the mid‑80s, where throughput remains robust without accelerating wear or compromising maintenance windows. Regular monitoring, root cause analysis, and incremental process improvements will help sustain favorable utilization distributions and support reliable, on-time delivery.

Top Selling Products