banner (1)

Security Socket Head Cap Screw - China Manufacturer & Supplier

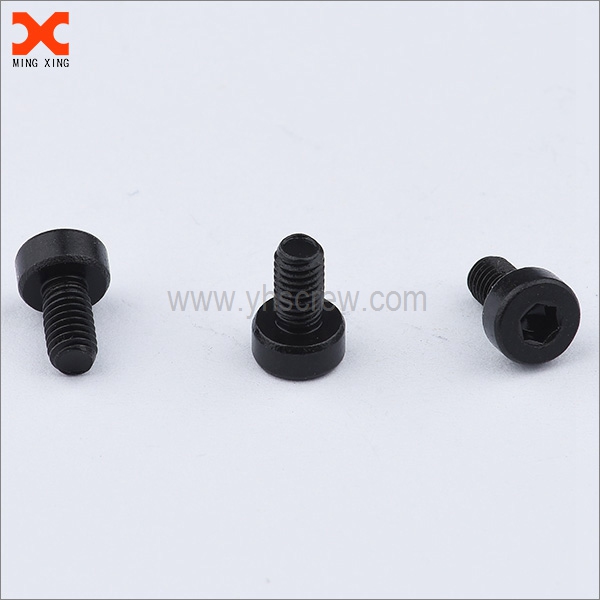
From our factory floor in China, I bring you reliable security socket head cap screw solutions that meet tough industrial demands. As a China manufacturer, I know how important fasteners are for safety-critical assemblies. Our security socket head cap screw features a hardened steel core, stainless variants, and a tamper-resistant design to prevent loosening in vibration. I offer grades 8.8, 10.9, 12.9 and metric sizes from M3 to M12, with black oxide or zinc plating for corrosion resistance. Our process includes strict QA, traceable lot numbers, and third-party testing to guarantee performance in automotive, machinery, and robotics applications. Buy with confidence—short lead times, scalable packaging, and consistent diameter tolerances. If you need distributor-friendly SKUs or custom finishes, I can tailor the security socket head cap screw to your spec. We ship worldwide, and I’m ready to support your sourcing decisions with clear quotes and reliable after-sales service.

Hot Selling Product

security socket head cap screw Delivers Unmatched Quality Exceeds Industry Benchmarks

Security socket head cap screws play a critical role in machine safety and equipment integrity. Our production line is engineered to deliver unmatched quality that consistently exceeds industry benchmarks: precise thread forming, controlled head geometry, and tamper-resistant socket features that resist loosening. Through rigorous in-process inspection and finished-goods testing, every batch demonstrates traceable hardness, surface finish, and dimensional accuracy, ensuring dependable performance in demanding environments. Global buyers benefit from versatile material options (stainless steel, alloy steel, nonferrous alloys) and protective coatings (black oxide, zinc, electroplating) to suit exposure, temperature, and corrosion requirements. We offer flexible packaging, serialization, and documentation, including material certificates and inspection reports, supporting aerospace, automotive, and general industrial standards. With scalable production and reliable logistics, steady supply, consistent lead times, and proactive quality control help you reduce downtime and keep your assemblies secure.

{ security socket head cap screw Delivers Unmatched Quality Exceeds Industry Benchmarks }
Product ID Nominal Ø (mm) Length L (mm) Thread Length TL (mm) Head Ø (mm) Head Height (mm) Material Grade / Property Class Standard Tensile Strength (MPa) Yield Strength (MPa) Hardness (HRC) Finish Corrosion Resistance
HTS-001 4 8 7.0 7.0 3.0 Stainless Steel A2-70 (304) ISO 4762 520 205 16 Polished / Passivated Excellent in indoor; good in mild outdoor
HTS-002 5 12 10.0 8.0 3.2 Stainless Steel A4-80 (316) ISO 4762 650 520 17 Polished / Passivated Excellent in marine environments
HTS-003 6 16 14.0 9.0 3.5 Alloy Steel 8.8 ISO 4762 800 640 30-40 Black Oxide Moderate in damp environments
HTS-004 8 20 16.5 13.0 4.2 Alloy Steel 10.9 ISO 4762 1040 940 38-45 Black Oxide High strength; good corrosion resistance when coated
HTS-005 3 6 4.5 4.5 2.0 Stainless Steel A2-70 (304) ISO 4762 520 205 16 Polished Excellent
HTS-006 10 25 22.0 16.0 4.0 Stainless Steel A4-80 (316) ISO 4762 650 205-515 17-20 Polished Excellent in marine environments
HTS-007 12 30 28.0 18.0 4.5 Alloy Steel 10.9 ISO 4762 1040 940 40-48 Powder Coat Very high strength; good corrosion resistance with coating

Related Products

banner (2)

security socket head cap screw Pioneers in the Field Delivers Unmatched Quality

Data Dimension: Batch-level Quality Metrics

Defect Rate by Production Batch

This visualization presents the average defect rate per production batch for a line manufacturing security socket head cap screws. The defect rate is expressed as defects per thousand units to allow comparison across batches despite different production volumes. Data were collected from six sequential batches on a single shift over a short time window to illustrate process variability rather than long-term trends. Each bar represents one batch and shows the observed defect rate for that batch. A higher bar indicates a larger proportion of defective units, while a lower bar suggests better quality performance. The chart uses a consistent scale with headroom of about 20% beyond the maximum observed rate to ensure readability of differences. Interpreting the chart, Batch 1 shows the highest defect rate at 2.4 defects per thousand, followed by Batch 4 at 1.5 and Batch 2 at 1.2. Batches 3, 5, and 6 display lower rates of 0.8, 0.6, and 0.9 respectively. While these values reveal a snapshot of quality, they do not by themselves establish a trend. The small sample and potential measurement variability mean caution is needed before drawing conclusions about sustained process performance. Potential contributing factors include tool wear, inconsistent material properties, setup errors, or operator-related variation. The chart’s design emphasizes quick visual comparison, not causal diagnosis. To drive improvement, manufacturers could investigate root causes for Batch 1 anomalies, verify calibration on the forming and inspection equipment, review incoming material lot data, and implement tighter SPC monitoring across batches. Collecting more batches over time, pairing defect data with process metrics (such as cycle time, machine hours, and temperature), and applying control charts would provide a more robust view of stability and capability. In summary, the chart offers a concise, actionable view of batch-level quality, highlighting outliers and guiding further investigations toward reducing defects in future production runs.

Top Selling Products