banner (1)

M1 4 Torx Screw - Wholesale & Manufacturers

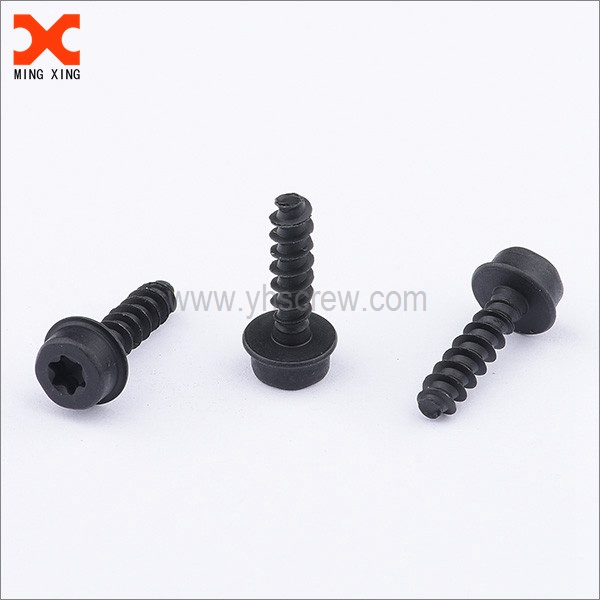
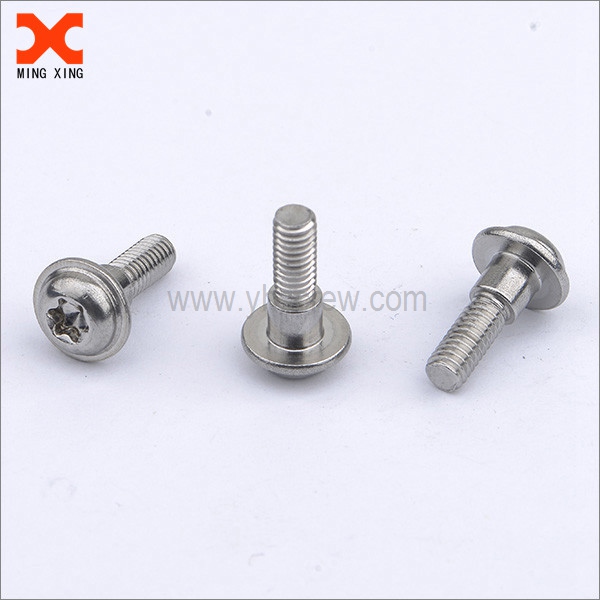
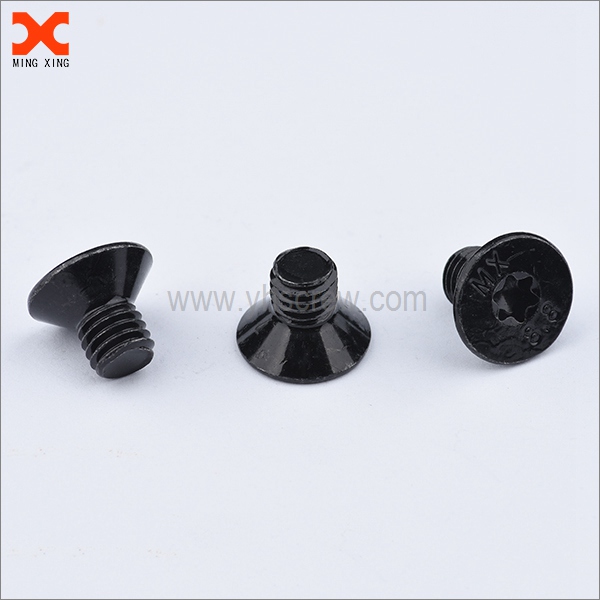
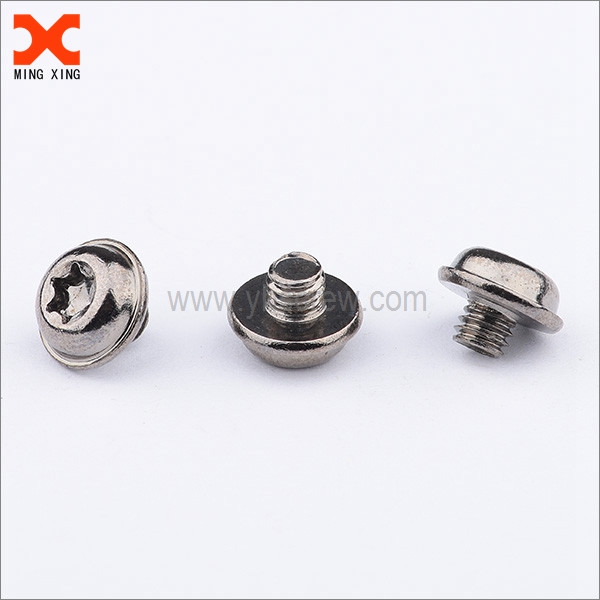
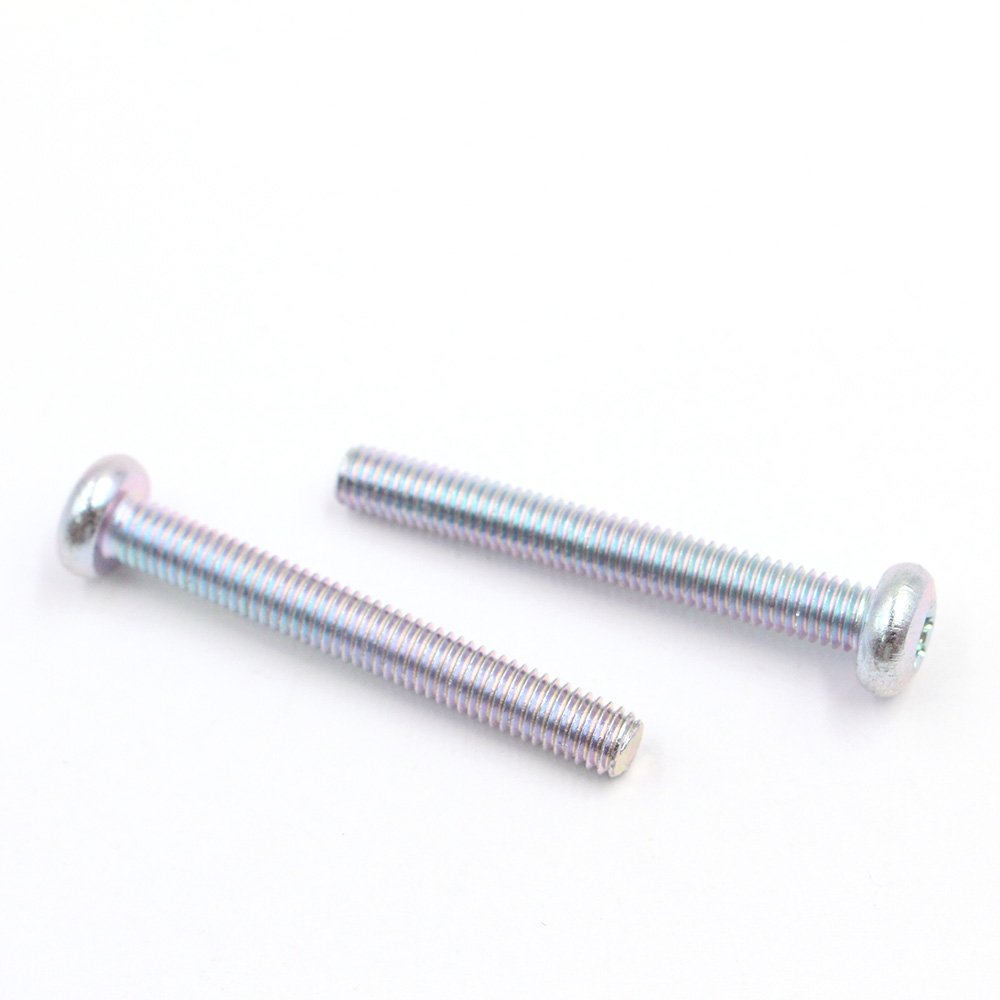
From the factory floor to your distribution channel, I stand behind the m1 4 torx screw as a reliable workhorse for precision assemblies. We supply this fastener in bulk to Wholesale buyers and Manufacturers who demand consistency, traceability, and quick delivery. The m1 4 torx screw features a robust stainless or alloy steel body, corrosion resistance, and a Torx drive that reduces cam-out under heavy torque. My team ensures tight tolerances, compatible thread size, and heat-treated coatings that stand up to demanding environments. We offer bulk packaging options, carton-level or pallet-level, designed for streamlined stocking and faster line changeovers. Whether you are assemble consumer electronics, automotive, or industrial equipment, this screw helps you keep production on schedule. I am confident in our lead times and quality control checks, so you can commit to just-in-time inventory without the risk of shortages. Reach out to discuss volumes and custom packaging for your Manufacturing operations and Wholesale needs.

Hot Selling Product

m1 4 torx screw Guarantees Peak Performance Exceeds Industry Benchmarks

An M1.4 Torx screw is engineered to deliver peak performance where space, weight, and reliability matter. The Torx drive enables higher torque transfer, reduces cam-out, and maintains clamp load through vibration and thermal cycling. In micro-electronic assemblies, wearables, and precision instruments, this small fastener ensures consistent preload, thread integrity, and long-term reliability, helping products meet demanding lifecycle requirements. For global buyers, sourcing excellence means strict process control and traceable data: tight tolerances, certified materials, heat treatment, and robust QA. Look for RoHS compliance, IPC/ISO 9001 accreditation, and documented test results for torque retention, loosening resistance, pull-out strength, and vibration endurance. Scalability, flexible packaging, and reliable on-time delivery across regions further reduce risk, delivering a total cost of ownership advantage while exceeding industry benchmarks.

{ m1 4 torx screw Guarantees Peak Performance Exceeds Industry Benchmarks}
Size Drive Material Finish Head Style Thread Pitch (mm) Tensile Strength (MPa) Yield Strength (MPa) Hardness (HRC) Min Torque (N·m) Max Torque (N·m) Pullout Strength (N)
M1.4 x 2.0 T4 A2-70 (304 SS) Bright Zinc Pan 0.30 520 210 18 0.04 0.08 40
M1.4 x 2.5 T4 A2-70 (304 SS) Black Oxide Pan 0.30 520 210 18 0.05 0.09 44
M1.4 x 3.0 T5 Ti-6Al-4V Natural Pan 0.30 900 860 36 0.07 0.12 75
M1.4 x 4.0 T5 A2-70 (304 SS) Bright Zinc Pan 0.30 520 210 18 0.08 0.13 60
M1.4 x 2.8 T4 A2-70 (304 SS) Nickel Plated Pan 0.30 520 210 18 0.05 0.10 52

Related Products

banner (2)

m1 4 torx screw Ahead of the Curve Your End-to-End Solution

End-to-End Lead Time by Process Stage

Explanation: This dataset summarizes the end-to-end lead time across the main process stages in a hypothetical manufacturing workflow. The chart visualizes the time required at Design, Procurement, Assembly, Testing, Packaging, and Shipping, expressed in days, to illuminate where delays accumulate and how early-stage performance influences the whole cycle. The values are illustrative but crafted to reveal common bottlenecks and improvement opportunities in a curve-driven operation that aims to stay ahead of demand.

From the visualization, Procurement stands out with the longest lead time, followed by Design and Assembly. This pattern points to supplier coordination, specification clarification, and early design decisions as critical drivers of overall cycle time. Reducing lead time here could yield outsized gains, because shortening a delayed early stage often compresses downstream tasks by reducing wait times and rework. Design efficiency, in this sample, also shows room for optimization through modular design, clearer requirements, and more parallel work streams. The mid stages, such as Testing, show moderate durations, suggesting a relatively stable internal process with potential gains from test automation and parallel validation. Packaging and Shipping are comparatively shorter; nonetheless, optimizing handoffs to logistics can still shave days and reduce the risk of late deliveries.

Interpretation of this data should consider variation between projects, materials, and demand volatility. The chart demonstrates the value of end-to-end visibility: even small improvements at one stage can ripple through the entire chain, improving on-time delivery and customer satisfaction. For decision-makers, the next steps could include collecting daily throughput, tracking cycle time by batch, and benchmarking against industry targets to inform a continuous improvement program. This visualization serves as a simple but actionable snapshot, encouraging cross-functional collaboration and data-driven experimentation to stay ahead of the curve in a fast-moving landscape. Limitations: the numbers are synthetic and designed to illustrate relative ranking and gradient of effort rather than reflect actual performance. To translate into real improvement, teams should collect real lead times and perform root cause analysis using methods such as value stream mapping and cause-and-effect diagrams. The visualization should be refreshed with fresh data at regular intervals to track progress and to validate improvement hypotheses.

Top Selling Products