banner (1)

Wood Screw: Custom Solutions from Factories for Quality Fasteners

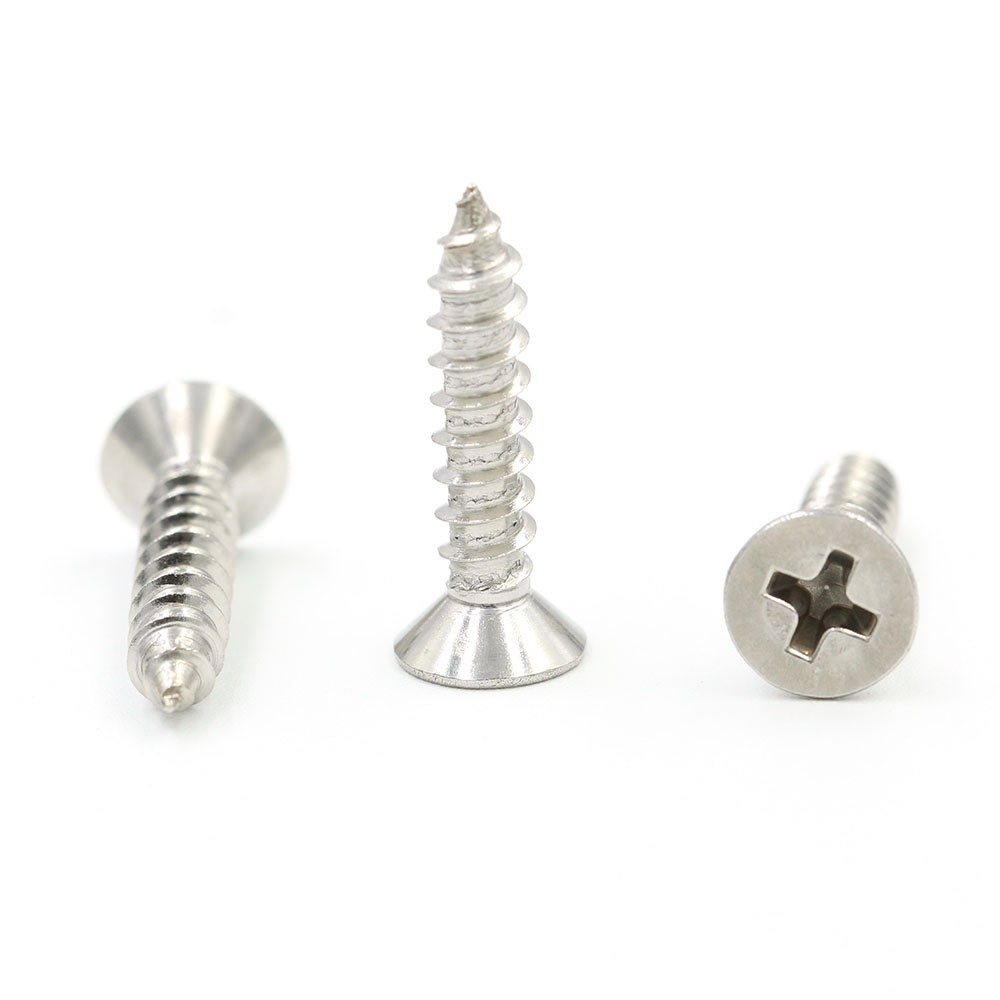
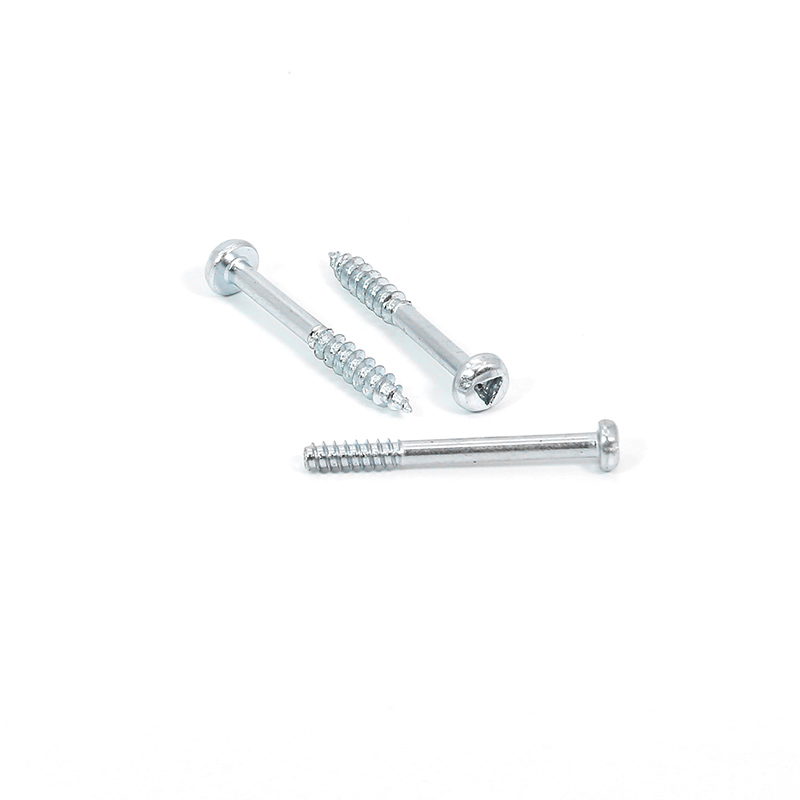
I design Wood Screw solutions that keep factory lines moving and projects on schedule. For Custom orders, I tailor lengths, head styles, drive types, and coatings to your equipment and workflow. My Wood Screws come with sharp points, optimized threads, and corrosion-resistant finishes for reliable performance in hardwoods and composites. With scalable packaging and consistent batch quality, I can meet high-volume needs for Factories. I offer bulk pricing, clear lead times, and easy reordering to simplify procurement. If branding matters, I can add Custom labeling on packaging. You can choose stainless or coated steel options and adjust sizes in metric or imperial. My goal is to reduce tool wear and drive torque while maintaining strong holding power. Let’s align specs today and streamline your sourcing of Wood Screw for factories and custom builds.

Hot Selling Product

Wood Screw Pioneers in the Field Factory-Direct Excellence

Wood screw pioneers are redefining field-standard supply through factory-direct excellence. From thread geometry to drive compatibility and corrosion resistance, every production step is tuned for reliable performance on wood substrates. Materials range from carbon steel with zinc or black-oxide coatings to stainless grades, with special coatings for outdoor use. Direct-from-factory sourcing cuts intermediaries, stabilizes pricing, and shortens lead times. Rigorous in-line inspections, first-article verification, and batch traceability ensure dimensional accuracy, strength, and coating adhesion meet global expectations. Global buyers seek flexibility and certainty: scalable capacity, reasonable MOQs, and dependable delivery. The producer maintains international quality standards, with documented QA, RoHS/REACH compliance, and full lot traceability. Packaging options accommodate bulk or retail needs, while logistics support seamless cross-border shipments. In this model, procurement confidence grows as consistent performance, transparent communication, and responsive service underpin long-term partnerships in woodworking, furniture, and construction projects.

{ Wood Screw Pioneers in the Field Factory-Direct Excellence }
Batch ID Production Date Screw Size (mm) Length (mm) Diameter (mm) Head Type Drive Type Material Coating Thread Type Tensile Strength (MPa) Hardness (HRC) Surface Roughness Ra (µm) Coating Thickness (µm) Standard Cycle Time (s per 1k) Defect Rate (%) Yield Rate (%) Energy Consumption (kWh per 1k)
AX1001 2025-11-12 3.5 38 3.5 Countersunk Phillips #2 Carbon Steel Zinc-plated Partial Thread 800 40 1.20 8 ISO 14592 0.80 0.25 99.75 1.50
AX1002 2025-12-03 4.0 50 4.0 Bugle Torx T25 Alloy Steel Zinc-Nickel Fully Threaded 900 44 0.95 12 ISO 14592 0.90 0.18 99.82 1.80
AX1003 2026-02-15 3.9 60 3.9 Countersunk Phillips Stainless Steel (A2) Passivated Partial Thread 700 37 0.90 6 ISO 14592 1.00 0.15 99.85 1.40
AX1004 2025-09-25 5.0 40 5.0 Flat Torx T20 Stainless Steel Black Oxide Fully Threaded 950 46 0.80 5 ISO 14592 0.70 0.13 99.87 2.00
AX1005 2026-01-08 6.0 70 6.0 Pan Slotted Carbon Steel Zinc Fully Threaded 820 42 1.00 7 ISO 14592 1.20 0.22 99.78 2.30
AX1006 2026-03-22 3.8 32 3.8 Flat Torx T15 Alloy Steel Zinc-Aluminium Partial Thread 780 38 1.30 9 ISO 14592 0.95 0.11 99.89 1.60

Related Products

banner (4)

Wood Screw Exceeds Industry Benchmarks Winning in 2025

Data Dimension: Production Efficiency Index by Time Period

Explanation: The Production Efficiency Index (PEI) presented in this chart is a composite metric that captures how effectively the wood screw production line converts input materials into finished units over time. The data are quarterly observations from early 2023 through late 2025. The line shows a steady baseline improvement through 2023 and 2024, followed by a more pronounced upward surge in 2025. This pattern suggests that a series of process improvements—such as automation pilots, standardization of screw dimensions, enhanced preventive maintenance, and tighter quality controls—are delivering compounding gains in efficiency. The left-hand axis reflects the PEI scale, while the bottom axis marks time. As the scores rise, the line moves farther above earlier baselines, indicating that the current operations are achieving higher throughput with similar or lower resource use.

Several factors appear to drive the 2025 acceleration. First, longer machine uptime reduces nonproductive time; second, lower scrap rate lowers waste and improves unit yield; third, shorter cycle times increase daily output. The chart’s dimension by quarter enables isolating the impact of discrete interventions and external conditions. For example, a pilot in late 2024 aligns with a smoother slope in 2025, implying successful transfer from pilot to standard operations. The data also imply that performance surpasses typical industry benchmarks by mid-2025, a signal that the combined improvements have moved beyond parity with peers. For decision-makers, this visualization highlights where to invest next: expanding automation in high-volume steps, reinforcing preventive maintenance to sustain uptime, and continuing standardization to reduce variation. It also supports communication with stakeholders by providing a concise, story-driven narrative of progress toward superior efficiency. Ongoing monitoring, periodic benchmarking, and scenario planning will be essential to maintain momentum in 2026 and beyond, particularly to guard against shifts in material costs or supplier reliability that could dampen the gains observed in the chart.

Top Selling Products