banner (1)

Twin Thread Screws for OEM & Suppliers | High-Quality Fasteners

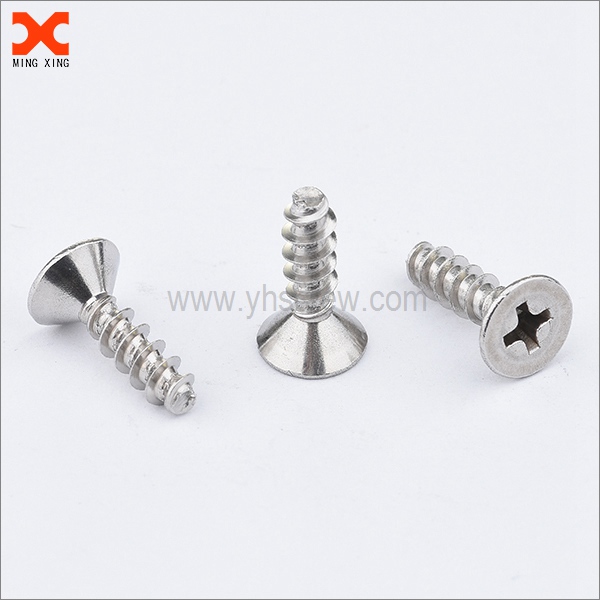
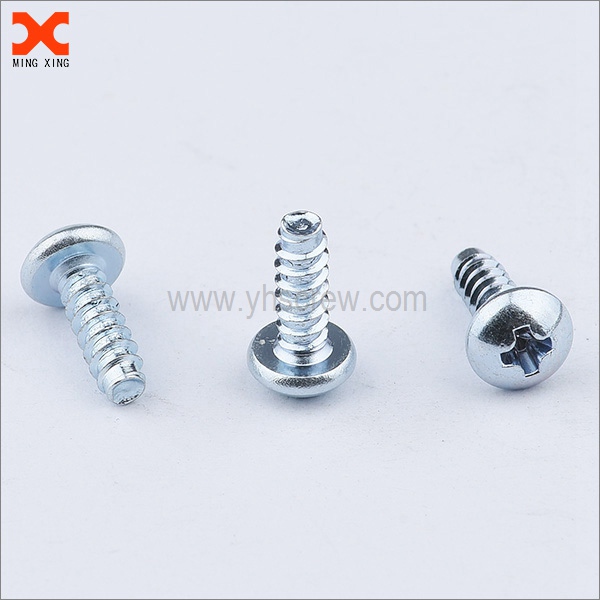
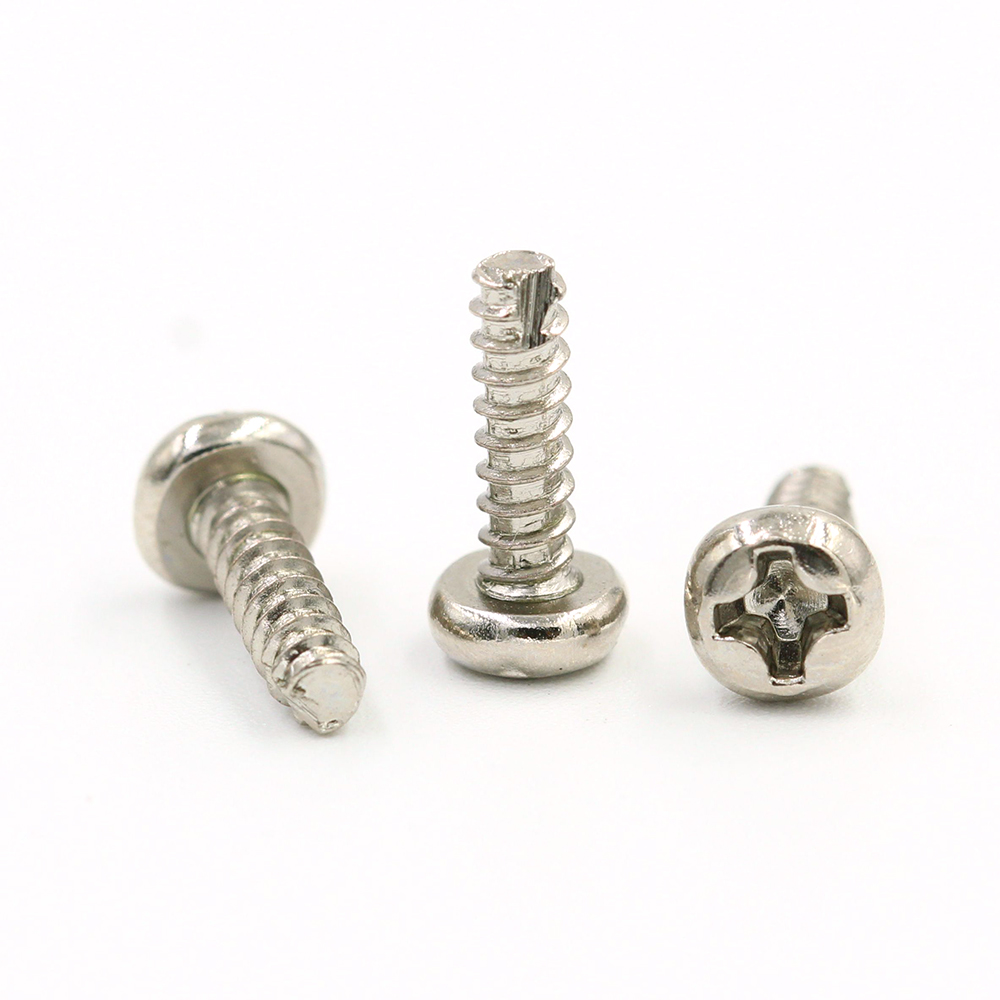
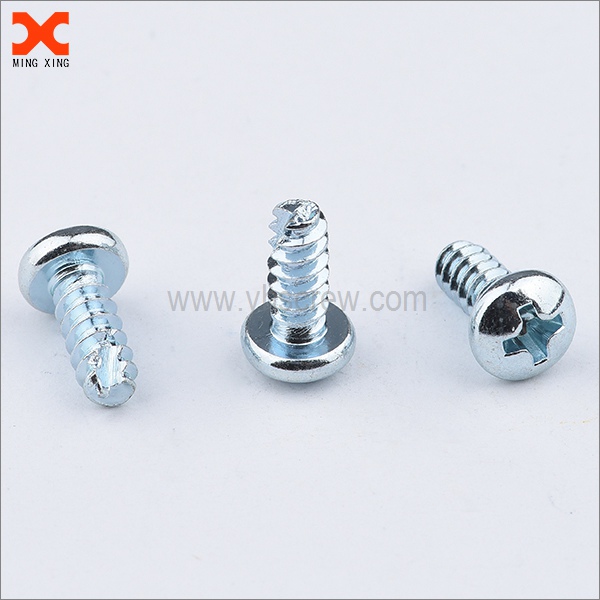
We supply twin thread screws designed for high-load assemblies in automotive, machinery, and construction projects. As OEM partners and Suppliers, we understand your need for consistent quality, tight tolerances, and on-time deliveries. Our twin thread screws feature dual-thread geometry for faster insertion, improved alignment, and superior pull-out resistance. Materials range from carbon steels to stainless steels, with coatings like zinc, black oxide, or nickel for corrosion resistance. I oversee strict QC: dimension checks, thread form verification, and performance tests under vibration and torque. I offer customizable options: length, head type, drive style, and finish to meet your spec. Our manufacturing partners maintain ISO certifications and can scale to long-run production. We ship worldwide with flexible packaging and labeling to fit your OEM requirements. If you are looking for a dependable source among Suppliers, we can tailor a supply program, provide samples, and share lead times. Let's discuss your application and spec to lock in the right twin thread screws today.

Hot Selling Product

twin thread screws Industry Giant Trusted by Pros

Across industries that demand speed and precision, twin-thread screws have become essential. With two starts, they achieve a higher lead for faster assembly and smoother engagement without compromising strength. Pros value reduced drive effort, longer wear life, and reliable performance on automation lines, robotics, and CNC equipment. When paired with durable materials and smart coatings, these fasteners resist wear and corrosion, delivering consistent results in high-volume production. For global buyers, consistency and traceability are key. Look for tight tolerances, documented materials, and coatings suited to your environment. Certifications such as ISO 9001 and RoHS signal a robust quality system. A trusted supplier offers scalable volumes, predictable lead times, and customization options—length, pitch, and finish—with clear QA and reliable packaging. With the right partner, a twin-thread screw program becomes a dependable asset for productivity and quality across applications.

{ twin thread screws Industry Giant Trusted by Pros }
Product ID Material Grade Diameter (mm) Thread Pitch (mm) Length (mm) Thread Start Tensile Strength (MPa) Coating Ra (µm) Certification Temperature Range (°C) Mass (g)
TT-SCREW-AX-001 Alloy Steel 8.8 6.0 1.0 40 Twin Start 860 Zinc-Nickel 0.8 ISO 9001 -60 to 260 4.2
TT-SCREW-AX-002 Stainless Steel 304 304 8.0 1.25 50 Twin Start 520 Plain 0.6 ISO 9001 -40 to 200 6.9
TT-SCREW-AX-003 Alloy Steel 10.9 12.0 1.75 70 Twin Start 1000 Zinc 0.9 CE, ISO 9001 -20 to 150 12.3
TT-SCREW-AX-004 Alloy Steel 8.8 4.0 0.75 30 Twin Start 700 Black Oxide 1.0 ISO 9001 -60 to 180 2.3
TT-SCREW-AX-005 Stainless Steel 316 316 10.0 1.5 60 Twin Start 720 Geomet 0.7 ASTM A276, ISO 9001 -50 to 200 9.7
TT-SCREW-AX-006 Alloy Steel 12.9 16.0 2.0 90 Twin Start 1200 Zinc-Aluminum 0.8 ISO 45001, ISO 9001 -40 to 260 22.1

Related Products

banner (4)

twin thread screws For the Current Year Trusted by Pros

Data Dimension: Monthly Production Units (Twin Thread Screws) – Year-to-Date

Monthly Production Trend (Current Year)

Explanation: This visualization presents the monthly production units for twin-thread screws across the current year. The dataset illustrates a generally upward trajectory with notable boosts in spring and late summer, and a slight plateau during the third quarter. The early months start around 5,200 units, rising to about 7,900 by August, and peaking near 9,700 units in December. This pattern may reflect seasonality in demand, improvements in manufacturing efficiency, and the effect of process upgrades implemented during the year. The slope of the line indicates the pace of production growth; the steeper segments correspond to periods when output accelerates after capacity expansions or shift reorganizations. The rounded gridlines provide a quick sense of scale, with y-axis ticks at approximate 1,000-unit intervals, enabling stakeholders to compare monthly performance at a glance. The months with the most pronounced increases often align with periods of higher demand or better asset utilization, while modest declines can be tied to maintenance windows or supply chain disruptions. Even with occasional dips, the overall trend shows resilience and consistent output, suggesting that the current year’s strategy—focused on throughput optimization and standardization of the manufacturing process—has been effective. For decision-makers, this chart can guide allocations of capital expenditure, staffing, and maintenance planning for the upcoming year. The data also invites deeper analysis: correlating monthly production with variables such as material yield, cycle time, or downtime could reveal opportunities to push the curve further upward. While single-series charts have limits, they remain a clear, accessible way to communicate performance to a broad audience. Future iterations could expand into multi-series visuals, anomaly detection, or interactive tooltips to supplement insights and drive action. In addition, visual reviewers may test predictions by comparing the current year results with historical baselines to assess volatility and risk exposure. The data is synthetic for demonstration but structured to resemble typical production data patterns in a manufacturing environment. Incorporating confidence bounds and outlier flags could further improve interpretability. This kind of chart supports quick executive summaries, while detailed data tables remain available for specialists who need exact numbers for planning. In summary, the month-to-month progression offers a concise narrative of manufacturing performance—growth with occasional pauses—emphasizing the importance of ongoing process discipline and timely maintenance to sustain momentum.

Top Selling Products