banner (1)

Tiny Screws Wholesale - Leading Manufacturers of Precision Fasteners

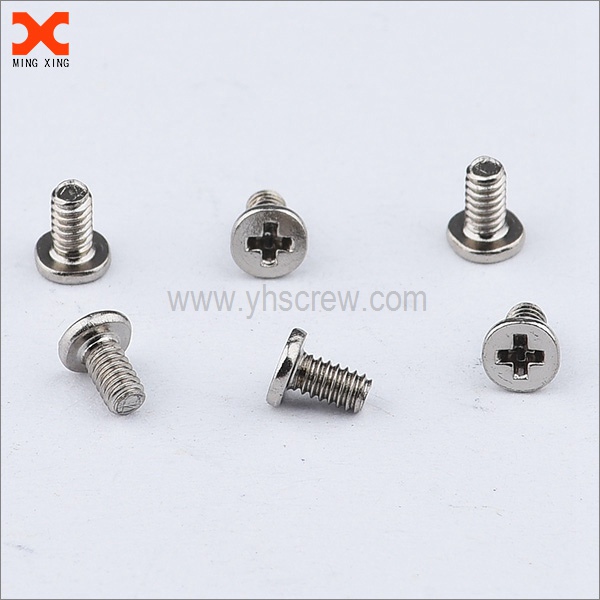
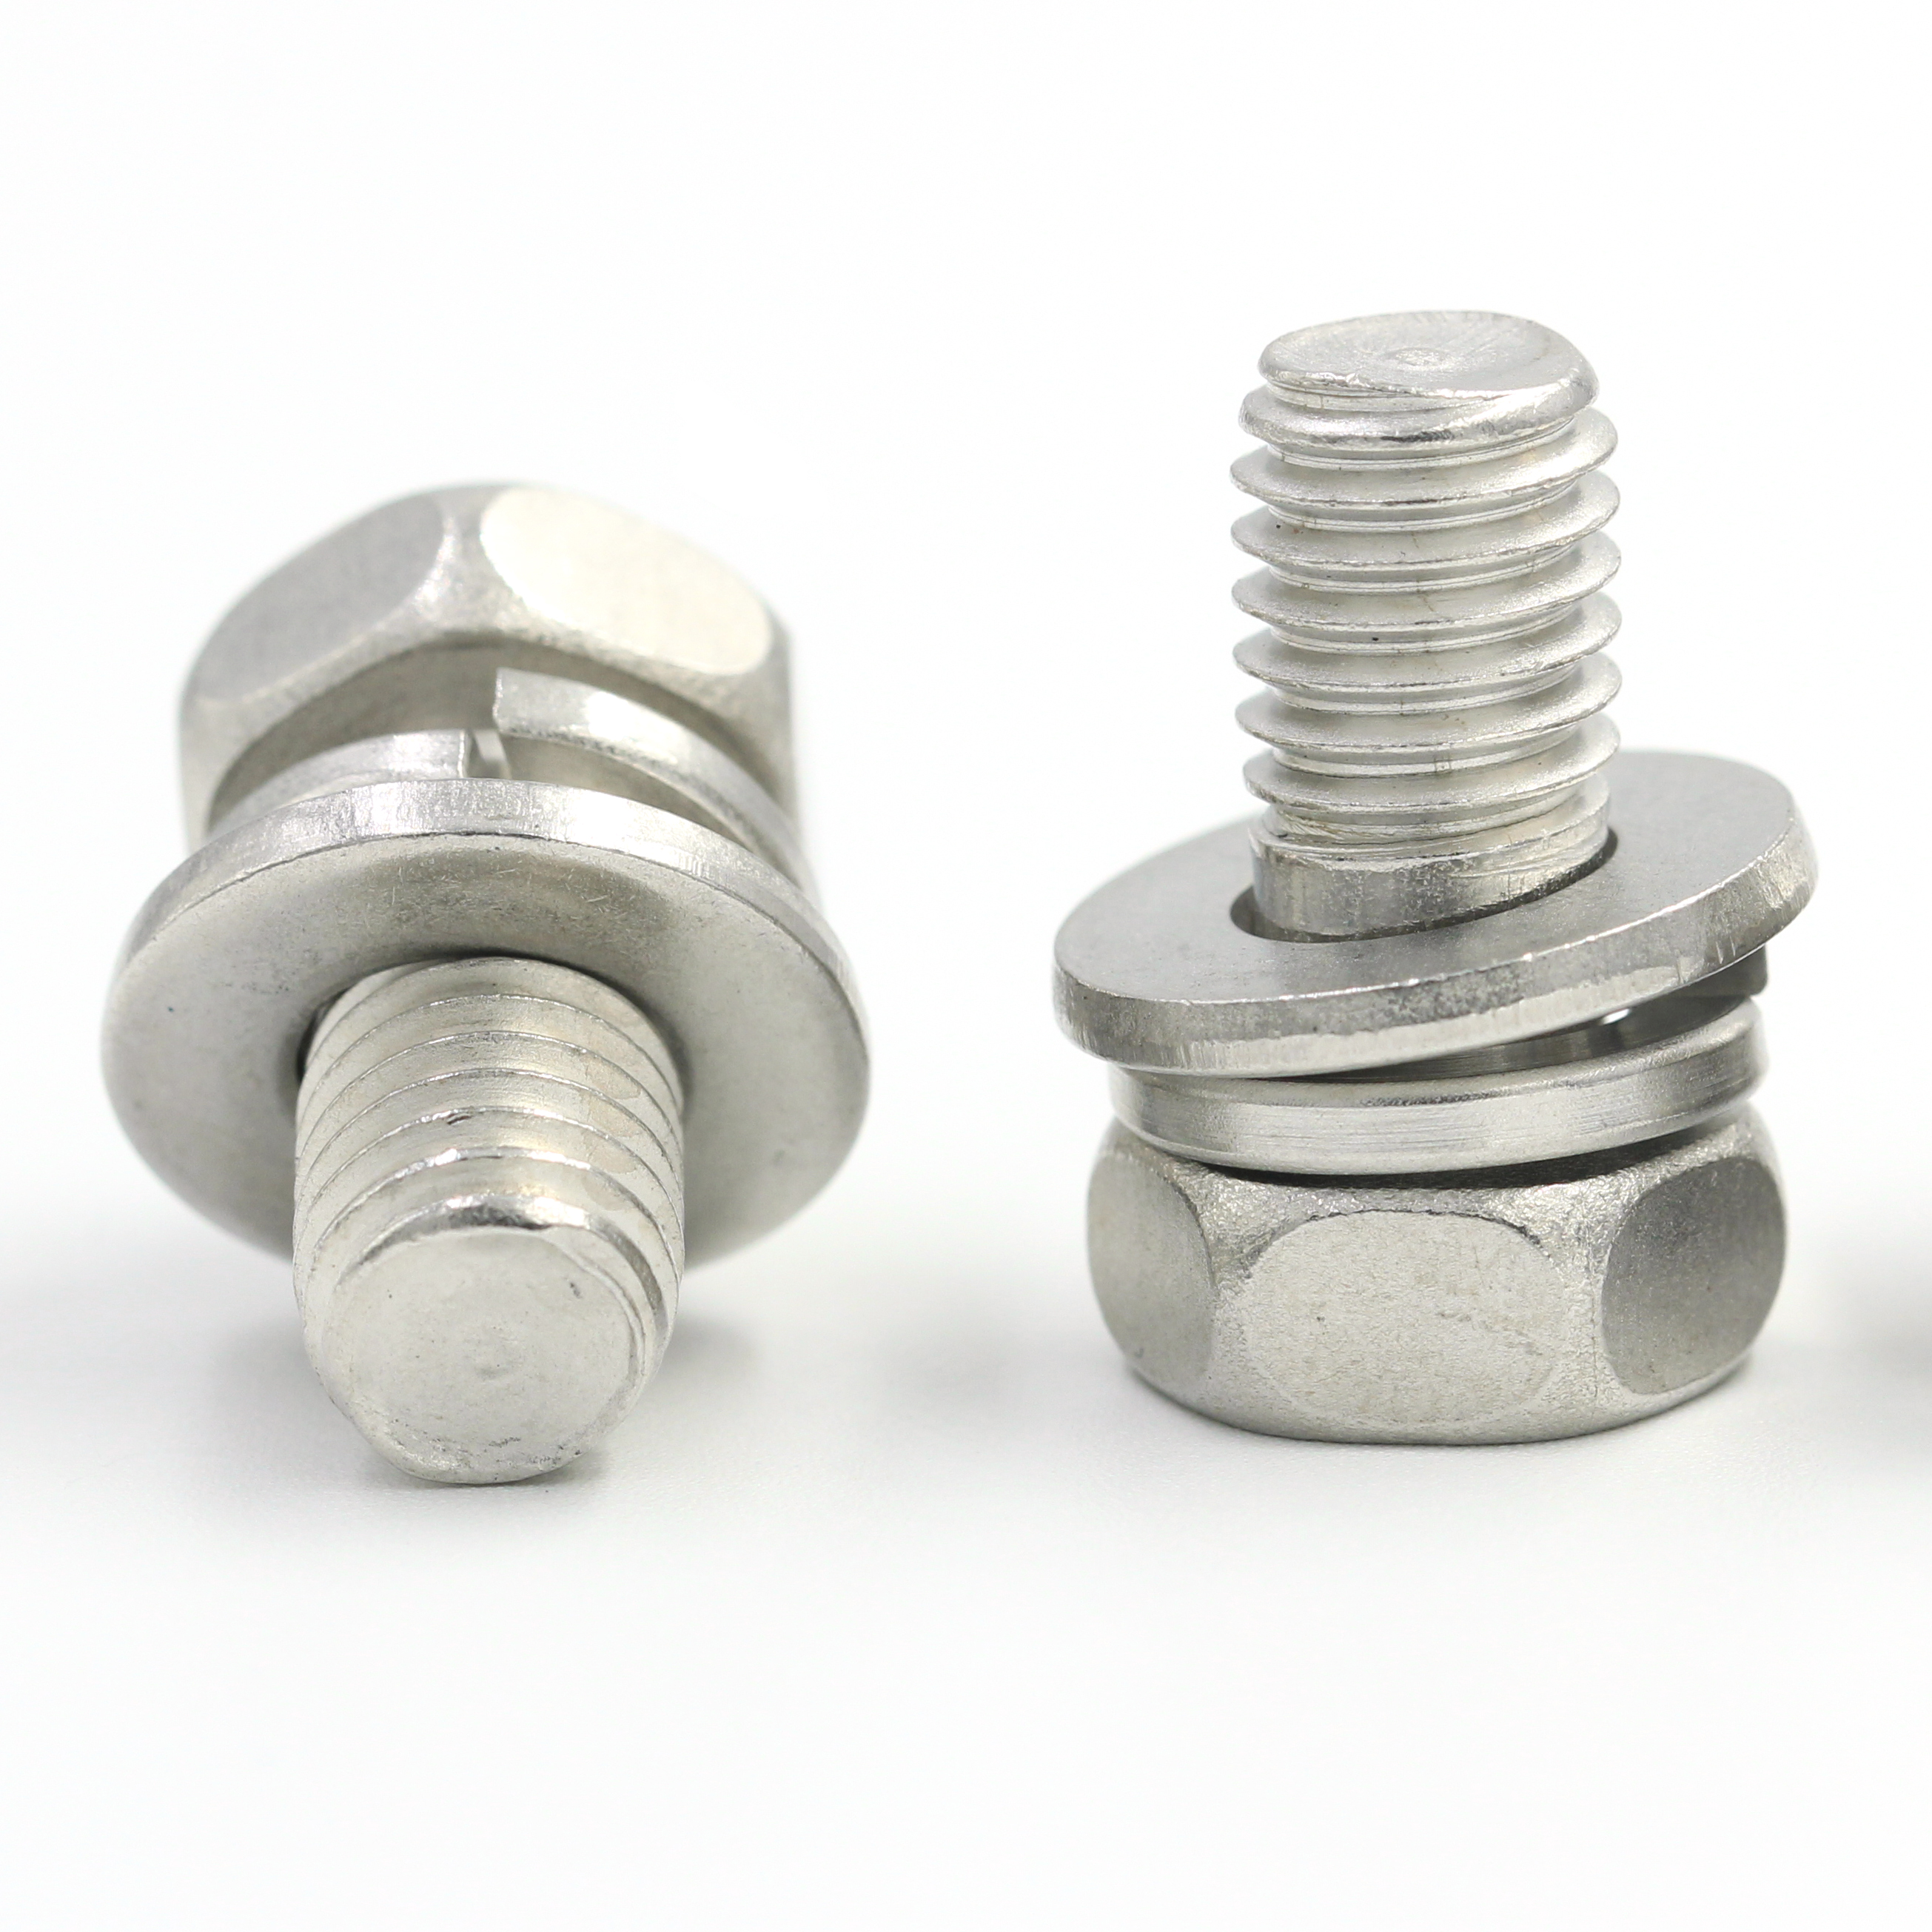
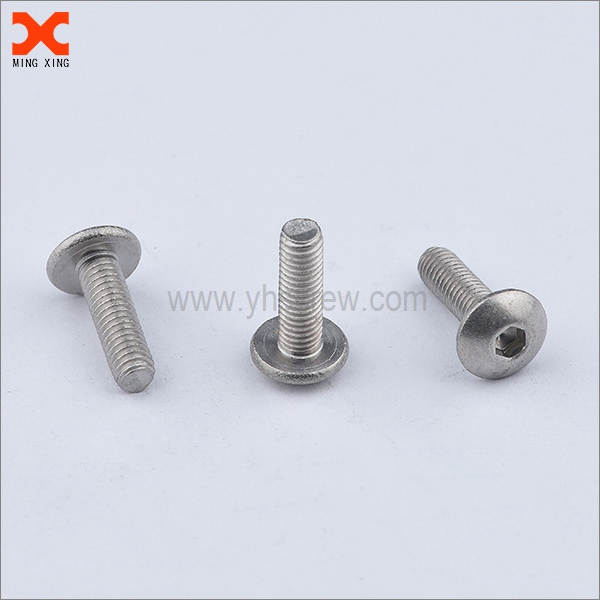
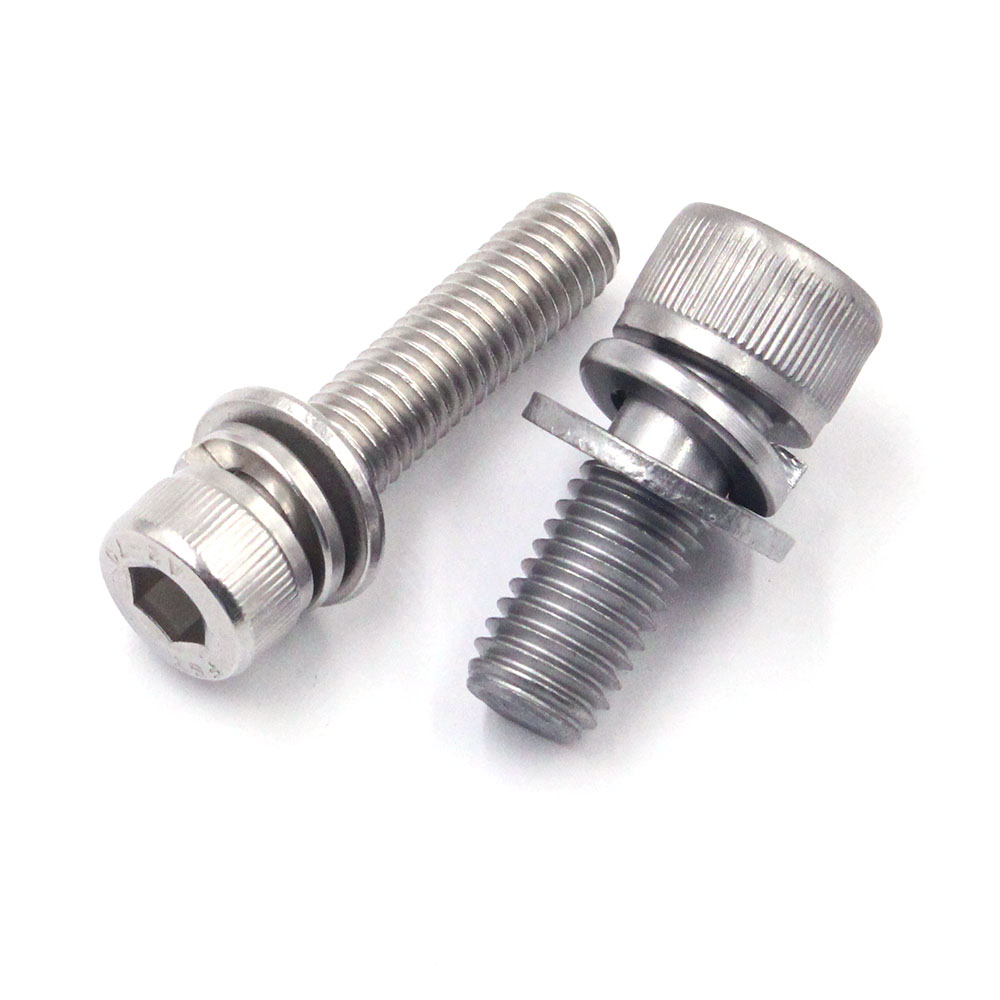
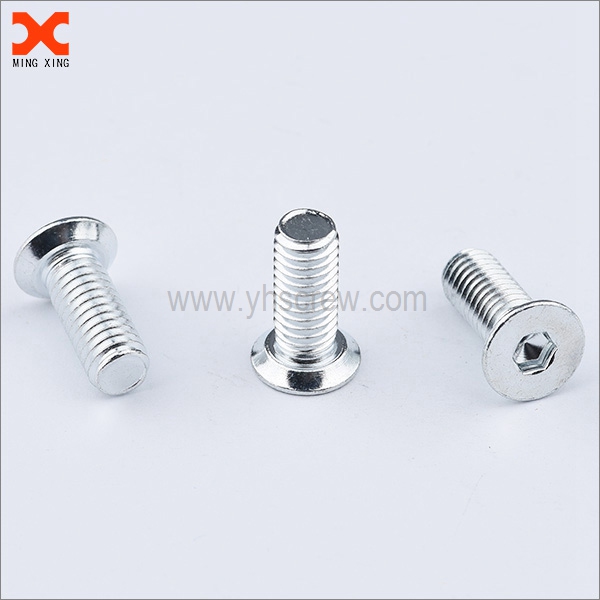
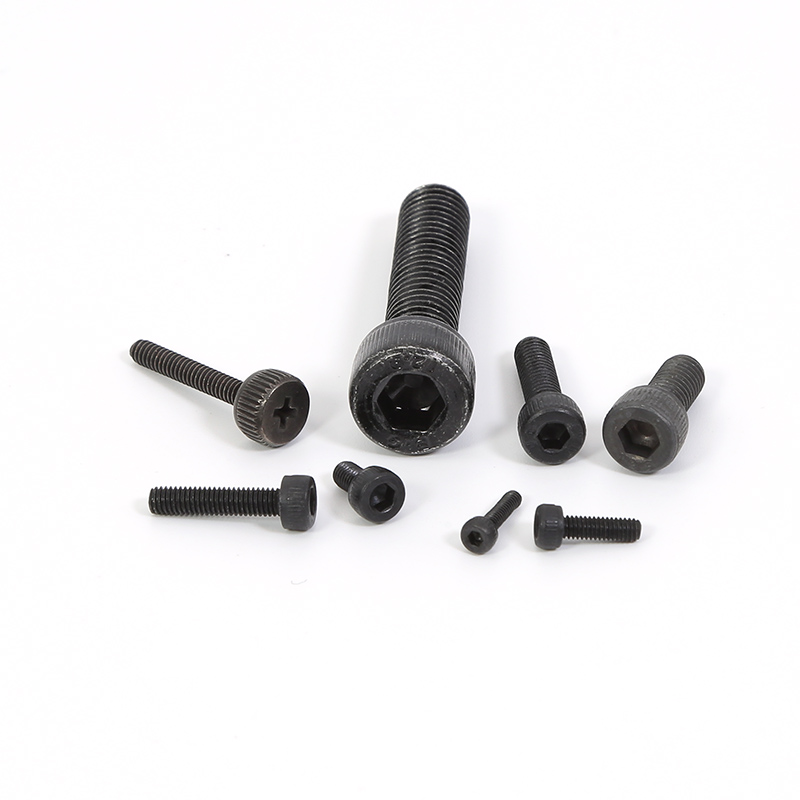
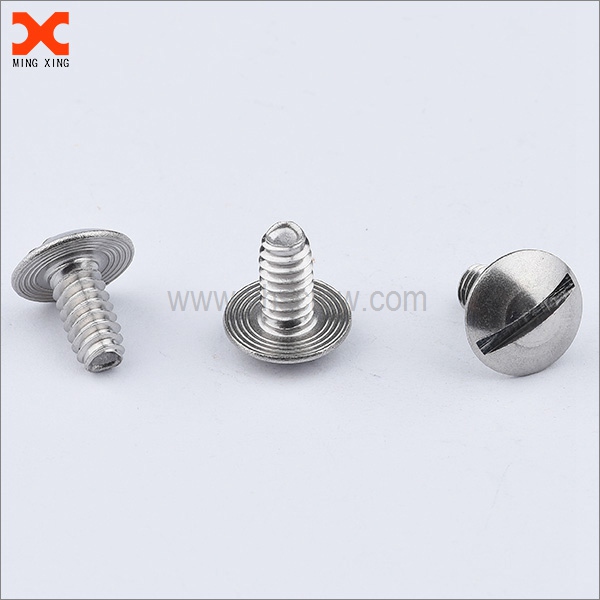
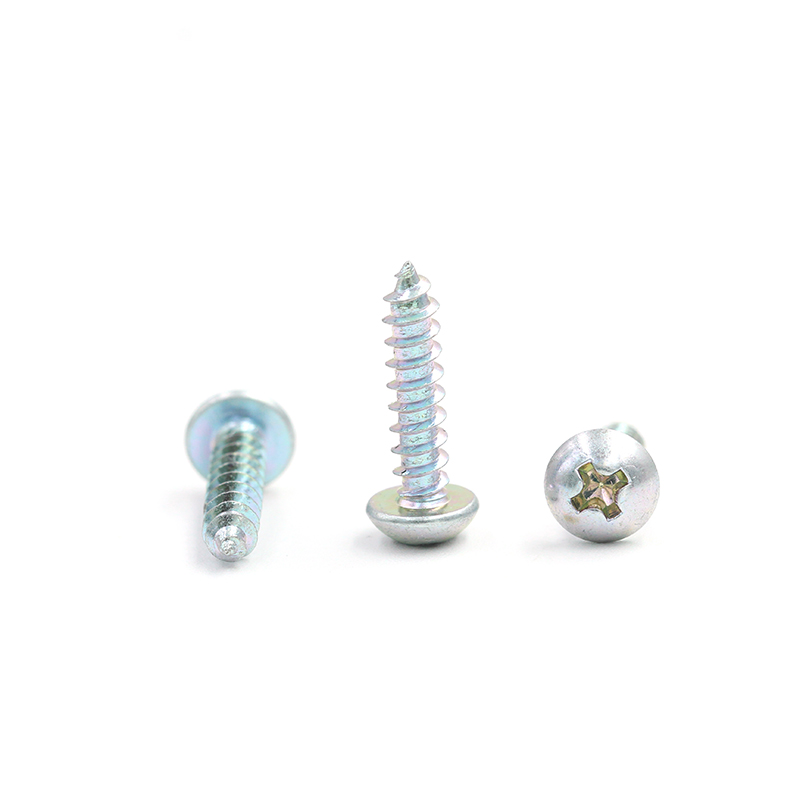
I source Tiny Screws in a carefully controlled process to meet high-volume production needs. For Wholesale orders, we offer bulk packaging, flexible MOQs, and reliable lead times. As a partner to Manufacturers, I know that consistent size, thread, and finish matter—our Tiny Screws are manufactured with tight tolerances, corrosion-resistant coatings, and multiple head styles (slotted, Phillips, Torx) to fit your equipment. We provide stainless steel, carbon steel, and brass options, with options for black oxide or zinc plating. Each batch comes with traceability and QA reports to ensure quality across runs. We stock a wide range of diameters and lengths, ready for immediate shipment, reducing line stoppages. This is more than just fasteners; it's a supply solution that reduces procurement complexity and saves you time and money. If you need custom head styles or finishes, we can tailor production for your unique specs, helping your project stay on track.

Hot Selling Product

Tiny Screws Now Trending Supplies the World\u2019s Top Brands

Micro-sized fasteners are becoming strategic enablers for electronics, automotive, and medical devices. As devices shrink, tiny screws—sub-millimeter diameters with torx, hex, or Phillips heads—must meet tight tolerances, hardness, and corrosion resistance. Demand spans materials like stainless steel, titanium, and brass and finishes such as nickel, black oxide, or PVD. Global buyers now seek suppliers offering flexible lot sizes, rapid sampling, and traceable batch data for design validation. Procurement success hinges on certified quality, reliable lead times, and resilient supply chains. Look for IPC/ISO-ready processes, RoHS/REACH compliance, and full traceability. Diversified sourcing and in-line quality checks reduce risk for critical assemblies. Request prototypes and accelerated sampling, plus packaging for automation. In a growing e-sourcing landscape, real-time stock visibility and transparent pricing help buyers secure steady micro-screw supply for ongoing programs.

{ Tiny Screws Now Trending Supplies the World's Top Brands}

Part_ID Diameter_mm Thread_Pitch_mm Length_mm Material Finish Head_Type Drive_Type Grade Standard Application
TS-001 2.5 0.45 6 A2-70 Stainless (304) Zinc Plated Pan Head Phillips A2-70 ISO 3506 Electronics enclosure
TS-002 3.0 0.50 8 A2-70 Stainless (304) Zinc Plated Button Head Torx A2-70 ISO 3506 Small machinery assembly
TS-003 4.0 0.70 10 A2-70 Stainless (304) Black Oxide Flat Head Slotted A2-70 ISO 3506 Electrical panel mount
TS-004 2.0 0.40 6 A4-80 Stainless (316) Satin Round Head Phillips A4-80 ISO 3506 Marine electronics chassis
TS-005 6.0 1.00 12 Carbon Steel Zinc Plated Socket Head Cap Hex (Allen) 8.8 ISO 898-1 Machinery frame
TS-006 5.0 0.80 16 A2-70 Stainless (304) Zinc Pan Head Phillips A2-70 ISO 3506 Computer server cabinet
TS-007 3.0 0.50 9 A4-70 Stainless (316) Nickel Plated Button Head Hex (Allen) A4-70 ISO 898-1 Humidity-resistant electronics
TS-008 4.0 0.70 8 A4-80 Stainless (316) Black Zinc Flat Head Torx A4-80 ISO 3506 Automotive trim

Related Products

banner (4)

Tiny Screws Is The Best Service Backed by Expertise

数据维度:时间序列的服务性能指标

New Data Title: Monthly Service Performance Metrics
2.0 1.8 1.6 1.4 1.2 100 96 92 88 84 80 80 Average Resolution Time (hrs) First Contact Resolution Rate (%) Jan Feb Mar Apr May Jun Jul Aug Sep Oct Nov Dec
Explanation and narrative (approximately 300 words): This chart presents a data-centric view of monthly service performance over a year, using two complementary metrics: Average Resolution Time (in hours) and First Contact Resolution Rate (as a percentage). The left axis tracks time, where lower values indicate quicker handling, while the right axis tracks the share of issues resolved in the first contact, where higher values indicate stronger effectiveness. The 12 data points correspond to each calendar month, enabling a year-long trend analysis. Observations show that average resolution time begins around 2.0 hours in January and gradually decreases to about 1.2 hours by December, with some fluctuations in mid-year. This downward trajectory suggests improvements in triage, workflows, and agent proficiency. At the same time, first contact resolution rate climbs from the mid-80s percent in winter months to the mid-90s in late summer and fall, reflecting enhanced issue diagnosis, knowledge base accessibility, and escalation effectiveness. The relationship between the two metrics highlights a positive correlation: as agents resolve more issues on the first contact, the average handling time tends to decrease or stabilize at a lower level. This pattern aligns with best practices in service delivery, where rapid, accurate initial interactions reduce the need for follow-up tickets. The chart also reveals seasonal patterns: early-year ramp-up periods show modest gains in both metrics, followed by steady improvements through the mid-year, and a small plateau toward year's end as volume stabilizes. From a planning perspective, the data suggests that investments in training, documentation, and decision-support tools yield tangible gains in both speed and quality. Organizations can use this visualization to set monthly targets, monitor deviations, and identify months requiring additional resources or process tweaks. Because the two metrics are tied to expertise and process maturity, continuing education and knowledge sharing are likely to sustain the favorable trend. In summary, the chart demonstrates that consistent expert-led service improves both responsiveness and resolution outcomes over time.

Top Selling Products