banner (1)

Shoulder Screws Thumb Screws - Custom Parts from Factories

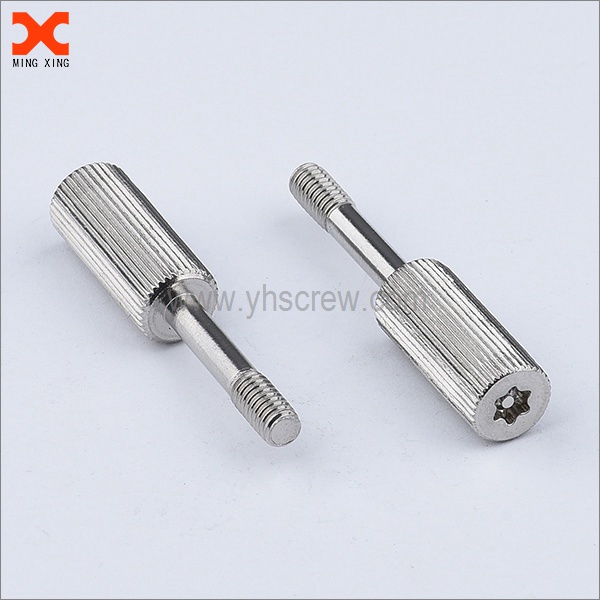
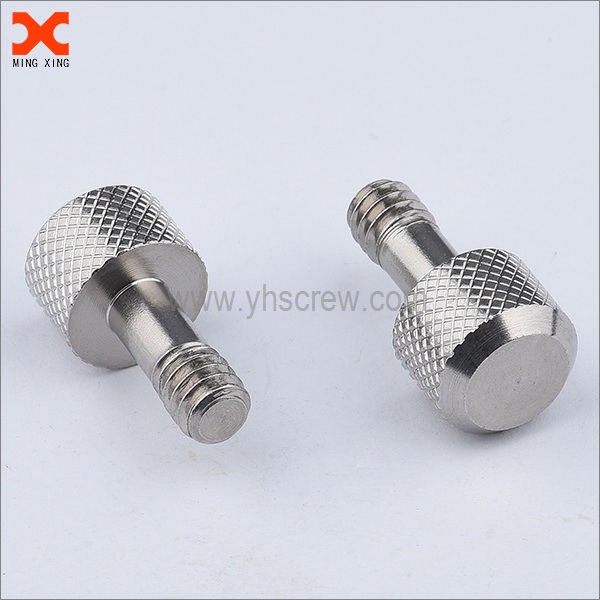
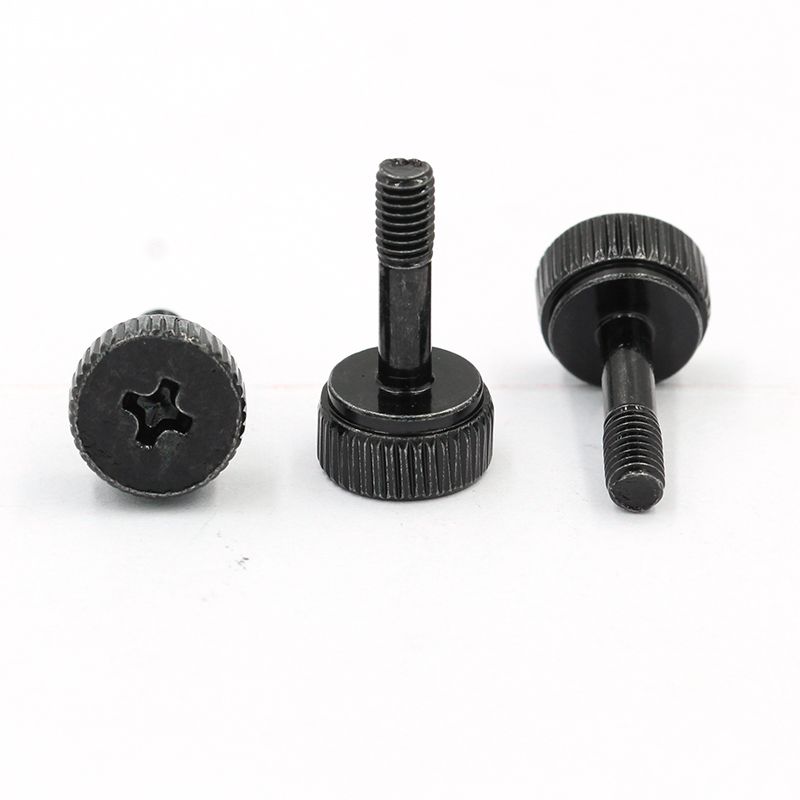
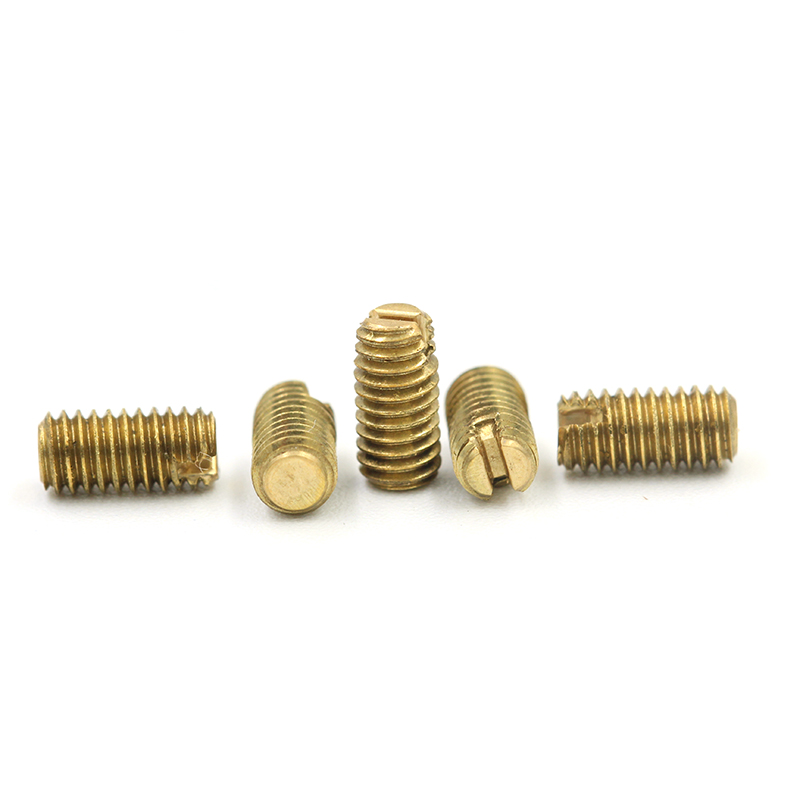
We supply high-quality Shoulder Screws Thumb Screws for durable, precise assemblies in automation, robotics, and equipment manufacturing. Our line blends Shoulder Screws with knurled or captive Thumb Screws to cover both alignment and quick-hand adjustments in one trusted kit. For Buyers, we offer Custom options: lengths, head styles, shoulder diameters, materials, and coatings tailored to your CAD specs, with consistent tolerances. We serve large-scale Factories needing steady supply, bulk pricing, and on-time delivery. Our manufacturing partners produce to ISO quality standards, with in-house inspection and traceability. We can propose stainless steel (A2 / A4), alloy steel, aluminum, or brass, with finishes such as zinc, black oxide, or passivation. By choosing us, you get predictable performance, reduced assembly time, and minimal maintenance. Tell us your dimensions and load, and we’ll propose a spec that keeps your line running smoothly.

Hot Selling Product

Shoulder Screws Thumb Screws For the Current Year Service Backed by Expertise

Shoulder screws and thumb screws are essential fasteners for global engineering—from robotics to electronics and enclosures. Shoulder screws deliver precise axial spacing and smooth bearing surfaces, enabling repeatable assemblies. Thumb screws provide quick, tool-free adjustments for panels and access doors. Buyers seek materials such as stainless steel for corrosion resistance, aluminum for light weight, and brass for electrical applications, plus varied shoulder diameters and drive styles to fit existing hardware. Year-after-year, service backed by expert machining and rigorous QC makes the difference in reliability and delivery. Expect tight tolerances, controlled processes, and traceability from raw material to finished part, with flexible lots and lead times to suit global projects. Certifications and standardized packaging support safe international shipping and predictable performance in challenging environments, helping procurement teams reduce risk and accelerate time-to-value.

{ Shoulder Screws Thumb Screws For the Current Year Service Backed by Expertise}

Part Type Material Finish Head Style Shoulder Dia (mm) Shoulder Length (mm) Thread Size Overall Length (mm) Drive Type Tolerance (mm) Compliance Lead Time (days) Application
Shoulder Screw Type S1 Shoulder Screw AISI 304 Stainless Steel Passivated Socket Head Cap 6.0 12.0 M6 18.0 Internal Hex ±0.05 RoHS, REACH, ISO 9001 5 Fixture assembly
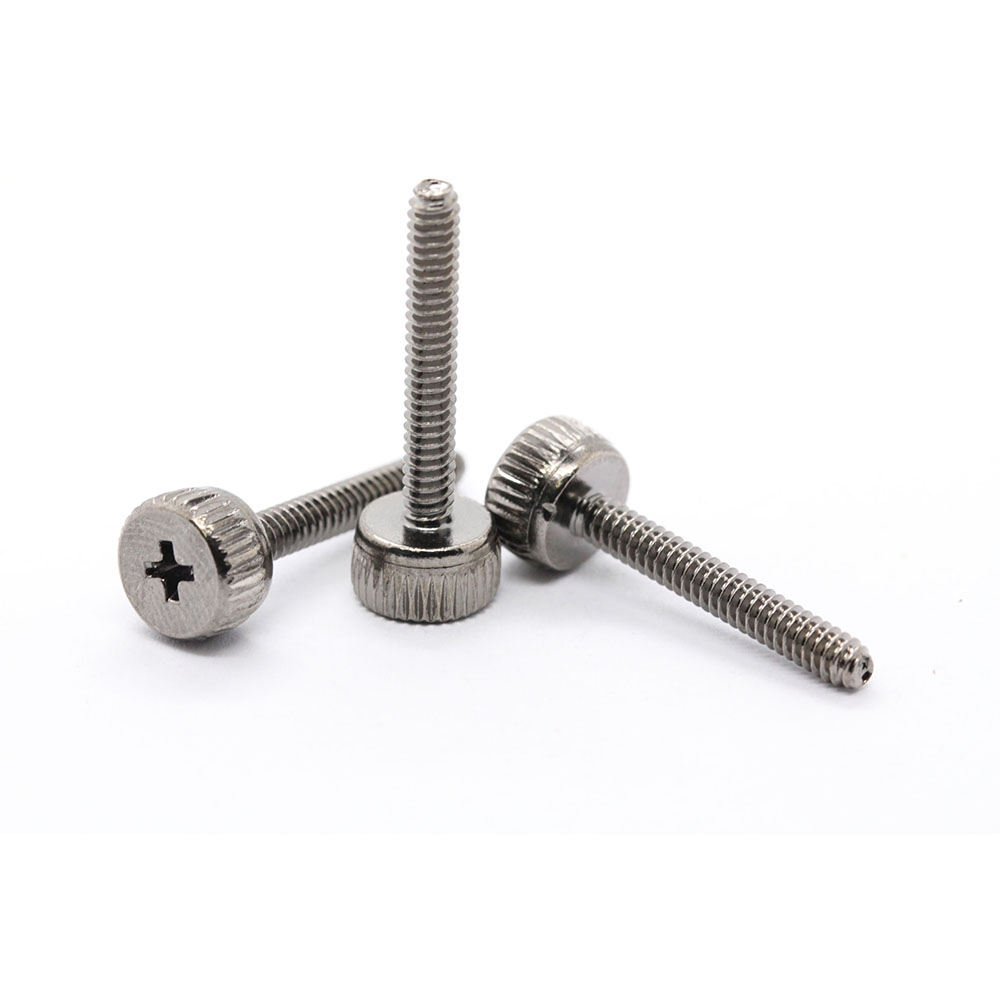
Thumb Screw Type T2 Thumb Screw AISI 316 Stainless Steel Satin Knurled Wing N/A N/A M6 14.5 Slotted (slot on head) ±0.05 RoHS, REACH, ISO 9001 3 Electronics access panels
Shoulder Screw Type S2 Shoulder Screw Alloy Steel Black Oxide Socket Head Cap 8.0 20.0 M8 28.0 Internal Hex ±0.05 RoHS 5 Machine parts
Shoulder Screw Type S3 Shoulder Screw AISI 304 Stainless Steel Passivated Button Head 7.0 15.0 M6 21.0 Internal Hex ±0.05 RoHS, REACH 4 Bearing housings
Thumb Screw Type T5 Thumb Screw AISI 304 Stainless Steel Satin Knurled Round N/A N/A M4 10.0 Slotted ±0.05 RoHS 2 Panel fastenings
Shoulder Screw Type S5 Shoulder Screw AISI 316 Stainless Steel Passivated Socket Head Cap 5.0 12.0 M5 17.0 Internal Hex ±0.03 RoHS, REACH 3 Alignment pins

Related Products

banner (4)

Shoulder Screws Thumb Screws Service Delivers Unmatched Quality

Quality Metrics Across Production Lines

This chart presents a data dimension we call Quality Metrics Across Production Lines, tracked monthly over a calendar year. The left-hand axis shows Defect Rate (%), while the right-hand axis displays On-Time Delivery (%). The two series illustrate how quality and reliability interact in a manufacturing environment. The Defect Rate series begins near 1.8% in January and gradually declines to about 0.7% by December. The On-Time Delivery series runs from roughly 92% in January rising to just under 100% by year-end. Together, they reveal a general pattern: as the defect rate falls, the delivery performance improves, though not perfectly in lockstep. This suggests that certain quality improvements—such as tighter process controls, better calibration, or supplier quality checks—translate into fewer defects and fewer disruption events that push schedules off track.

The data dimension emphasizes cross-line monitoring, enabling a comparison of how different production lines contribute to overall quality. In practice, such a chart supports continuous improvement by signaling when the pace of defect reduction slows or when delivery reliability deviates from expected trends. It can help teams investigate potential root causes, such as equipment wear, changeovers, or material variability, and correlate them with observed performance changes. Additionally, the dual-axis format allows quick assessment of whether scaling quality improvements affects delivery lead times or if improvements are primarily related to planning. Stakeholders can use these insights to set targets, allocate resources, and prioritize preventive maintenance or training. Finally, this visualization supports drill-downs: by filtering to a single line or by adding more metrics (e.g., inspection pass rate, scrap rate), managers can gain deeper, actionable insights without losing the time-based context. The data were collected from standard manufacturing logs and QA checks, aggregated monthly, and prepared to be comparable across lines.

Overall, the chart demonstrates how quality engineering and operations planning work together to enhance both product excellence and on-time fulfillment. Exploratory analyses could include smoothing, outlier treatment, or seasonal adjustments to further refine pass rates and delivery reliability.

Top Selling Products