banner (1)

Micro Self Tapping Screws - High-Quality Supplier of Small Fasteners

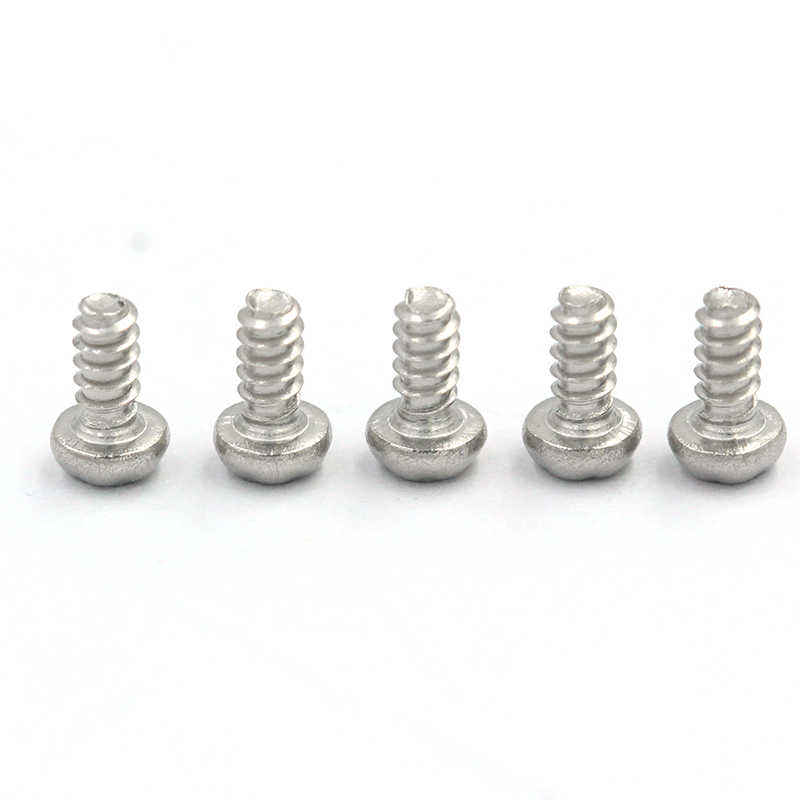
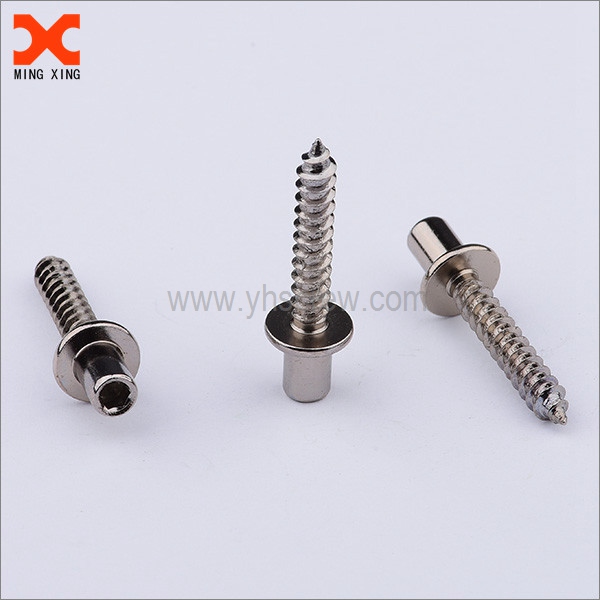
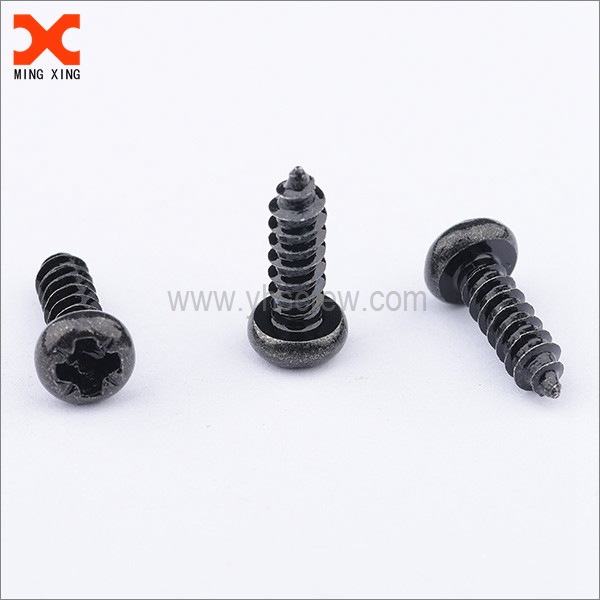
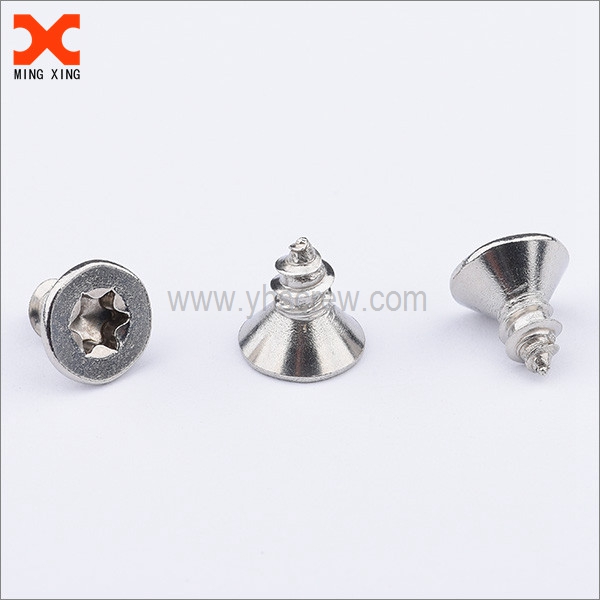
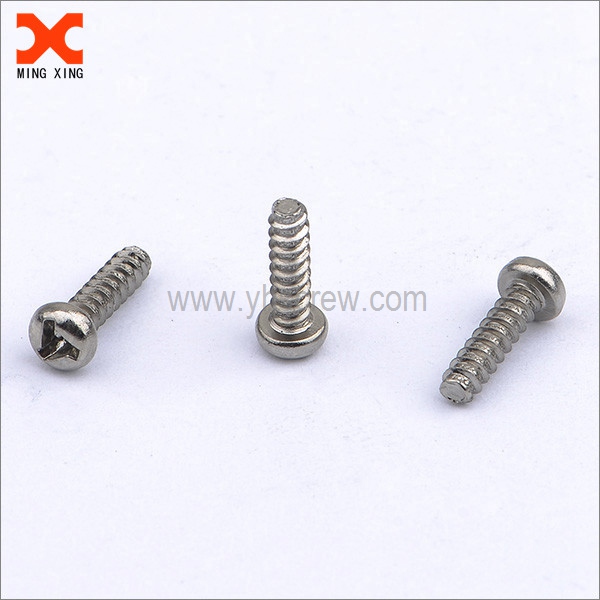
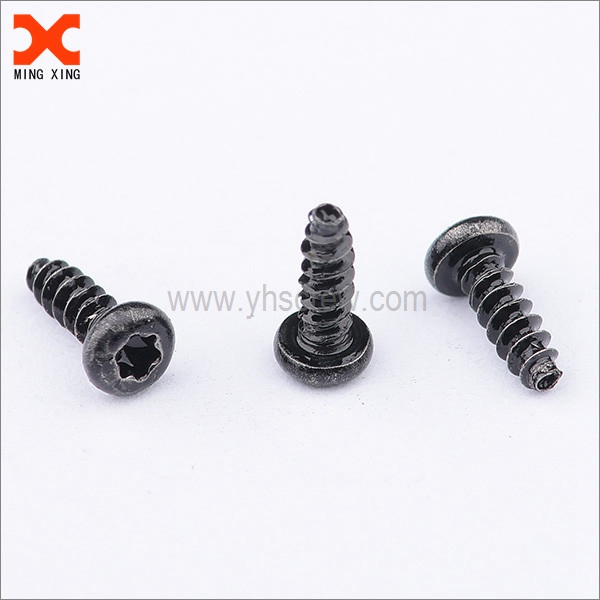
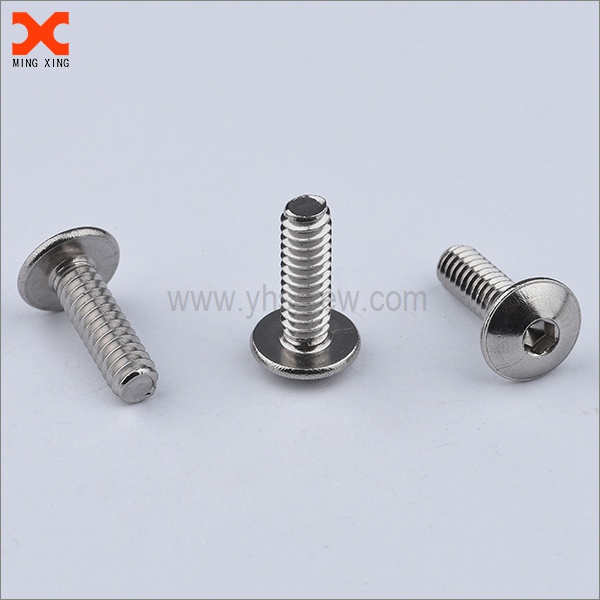
I’m your dedicated micro self tapping screws source, and I’m all about High-Quality parts that keep your production line moving. As a reliable Supplier, I stock sizes from M1.4 to M3, with threads designed for tapping into plastic, PCB housings, and thin metals. You’ll find stainless steel, alloy steel, and brass options, with zinc or black-oxide finishes for corrosion resistance. I offer consistent head style (pan, washer, flat) and grip length to suit your enclosure designs, with tight tolerances and fast lead times. My warranty covers defect-free packaging and accurate lot traces. Ordering is simple: single shipments or scheduled releases align with your manufacturing calendar. I’m here to help you minimize downtime and optimize assembly quality. Choose me as your partner for micro self tapping screws, because I believe in dependable performance, clear communication, and a true focus on your supply chain.

Hot Selling Product

micro self tapping screws Stands Out in 2025

As electronics and compact devices tighten designs, micro self-tapping screws stand out as a space-saving, reliable fastening choice. Typically under M3, these tiny screws deliver strong thread engagement in thin metals and plastics, trimming assembly steps and boosting joint integrity. Available in stainless or coated finishes, they resist corrosion and wear, with head types and drive styles optimized for automation and inline inspection. In 2025, the advantages center on automation compatibility, consistent quality, and scalable supply. With tighter tolerances and higher volumes, manufacturers emphasize precision threading, surface treatment, and traceable batch data to meet global standards. Flexible options in drive, pitch, length, and plating enable a single supplier to support diverse product families, while smart logistics and transparent lead times reduce risk for international buyers.

{ micro self tapping screws Stands Out in 2025}

Variant Size (mm) Material Finish Head Drive Thread Type Pitch (mm) Length (mm) Tensile Strength (MPa) Pull-out Strength (N) Pilot Hole (mm) Recommended Torque (Nm) Operating Temp (°C) Corrosion Resistance (Salt Spray hours)
A1 M1.0 Stainless Steel A2-70 (304) Bright Pan Torx T5 Coarse 0.25 6 520 650 1.0 0.15 -60 to 250 1000
A2 M1.2 Stainless Steel A4-70 (316L) Passivated Flat Torx T6 Coarse 0.30 8 550 800 1.2 0.18 -60 to 260 1100
A3 M1.4 Aluminum 6061-T6 Anodized Pan Phillips PH2 Coarse 0.35 10 320 420 1.4 0.12 -20 to 180 700
A4 M1.6 Stainless Steel A2-70 (304) Black Oxide Flat Torx T7 Coarse 0.40 12 540 900 1.6 0.22 -60 to 260 1200
B1 M2.0 Carbon Steel (HDG) Zinc Plated Pan Hex Socket Fine 0.40 16 480 1100 2.0 0.25 -60 to 250 900
B2 M2.5 Stainless Steel A4-70 (316L) Passivated Pan Phillips PH3 Fine 0.45 20 520 1200 2.5 0.32 -60 to 260 1100
B3 M3.0 Carbon Steel (HDG) Zinc Plated Flat Hex Socket Coarse 0.60 25 400 1400 3.0 0.45 -40 to 180 600
B4 M4.0 Stainless Steel 304 Bright Pan Torx T8 Fine 0.70 30 550 1500 4.0 0.55 -60 to 250 950

Related Products

banner (4)

micro self tapping screws Application Factory

Time-Series Metrics for Micro Self-Tapping Screws Application: Throughput and Defect Rate

New Data Perspective: Factory Efficiency over Time

Explanation and interpretation: This chart presents a twelve-month, time-series view of the micro self-tapping screw assembly line. Two metrics are tracked: Throughput (units produced per day) and Defect Rate (% of parts failing final inspection). They are plotted on dual y-axes to allow clear comparison across different scales while preserving the integrity of each metric. Throughput reflects manufacturing capacity, line efficiency, maintenance windows, and schedule adherence. Defect rate captures quality performance, process stability, and the impact of training and tooling accuracy. The data suggest several narrative themes. First, throughput shows a general upward trend for the first half of the year, rising from about 120 units/day in January to around 190 units/day by July. This improvement aligns with stabilization of tool settings, smoother changeovers, and modest automation gains. Second, defect rate gradually declines from roughly 1.8% to about 1.0–1.3% during the same period, indicating that higher speed is not sacrificing quality and that quality assurance practices, such as poka-yoke, standardized torque protocols, and SPC monitoring, are effective. Third, the late-year months exhibit a small dip in production while defect rate remains flat or slightly increases; this pattern often corresponds to scheduled maintenance, batch changes, or supplier variability. These observations support decision-making: continuing investments in preventive maintenance and line balancing can push throughput higher without compromising quality, while targeted quality initiatives in months of heavy production can prevent rework costs. The visualization also provides a platform for cross-functional review, enabling operators, engineers, and managers to align on goals, track progress toward standard metrics, and detect early signs of drift. For deeper insights, this chart can be extended with additional signals such as cycle time, downtime, and scrap rate. In combination, these signals offer a holistic view of the factory's operational health and guide data-driven improvement efforts in micro-assembly environments.

Top Selling Products