banner (1)

Making self-tapping screws: ODM Factory for OEMs

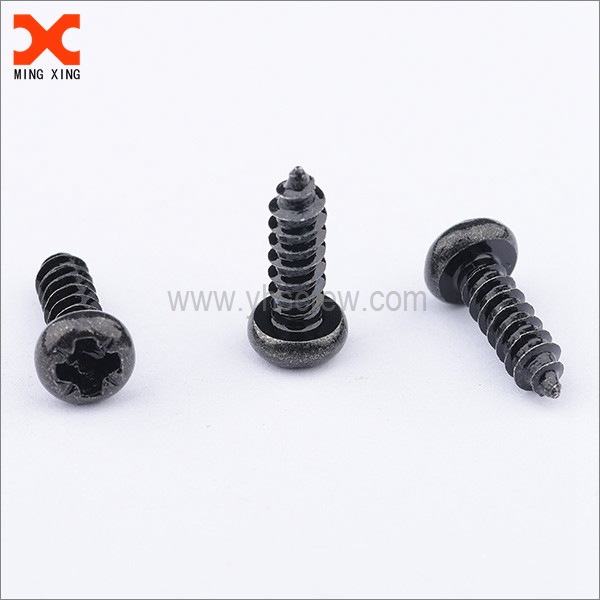
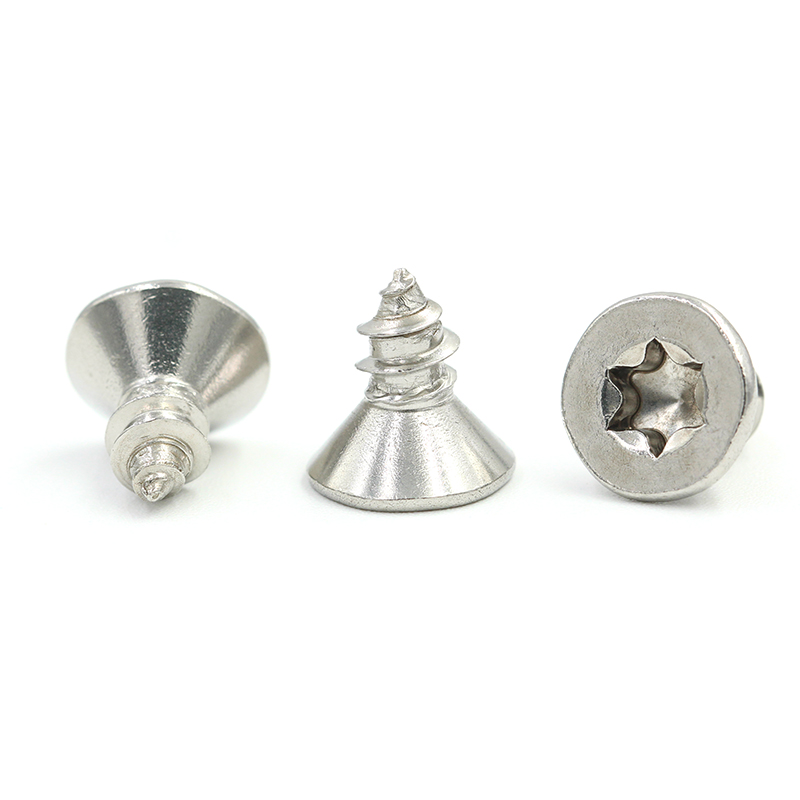
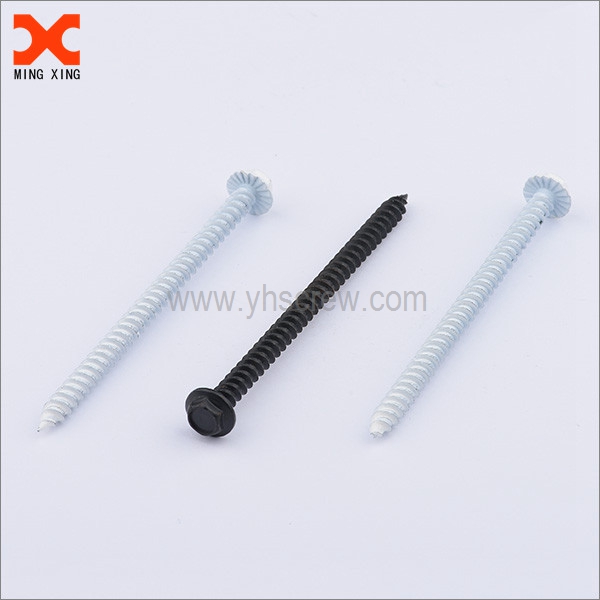
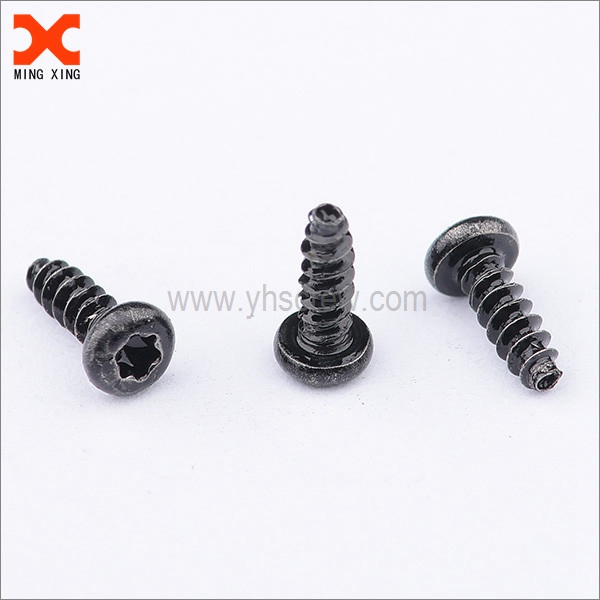
From concept to shipment, I help buyers nail down Making self-tapping screws that fit their application. Our team blends precision machining with smart metallurgy, delivering screws in carbon steel, stainless, and zinc-coated options. We tailor thread forms, head styles, and coatings through ODM collaboration, so you get parts that match your specs and brand. With direct-from-Factory production, we shorten lead times and simplify QC, offering scalable volumes and competitive MOQs. I know you need consistent torque, pull-out resistance, and corrosion protection, so I stress strict process control, third-party testing, and traceable lots. Samples, rapid prototyping, and tooling support are ready to accelerate your project. Whether you’re integrating into electronics enclosures, automotive trims, or consumer hardware, our Making self-tapping screws are designed to perform. Let’s discuss your drawings, and I’ll propose a robust, cost-effective solution through our ODM facility and Factory pipeline.

Hot Selling Product

Making self-tapping screws Products Outperforms the Competition

Self-tapping screws perform best when precision engineering meets controlled manufacturing. Optimized thread geometry, compact crest radii, and consistent pitch enable faster installation, lower insertion torque, and less thread deformation. Premium alloys, heat treatment, and corrosion-resistant coatings deliver high strength and long-term durability in varied environments, while strict quality controls ensure dimensional accuracy and repeatable performance. This combination supports reliable fastening in electronics, automotive, HVAC, and machinery, even in tight spaces or challenging materials. Adherence to international standards also helps buyers ensure compatibility and safety across supply chains. Global buyers benefit from partners offering customization for dimensions, heads, drives, and coatings, with scalable production and dependable on-time delivery. A supplier that aligns materials, tooling, and lean processes with rigorous QA and traceability reduces risk and total cost. In addition to OEM/ODM capabilities, these suppliers provide packaging, logistics support, and responsive after-sales service to fit timelines and regional needs.

{ Making self-tapping screws Products Outperforms the Competition }

Product Code Size Length (mm) Material Finish Head Type Drive Type Thread Type Coating Tensile Strength (MPa) Yield Strength (MPa) Shear Strength (kN) Max Torque (Nm)
ST304-PAN-M4-16 M4 16 Stainless Steel 304 Satin Pan Head Phillips Metric Coarse None 520 205 2.9 0.65
ST304-PAN-M4-20 M4 20 Stainless Steel 304 Satin Pan Head Phillips M4x0.7 None 520 205 3.2 0.70
ST304-PAN-M5-14 M5 14 Stainless Steel 304 Bright Pan Head Phillips M5x0.8 None 520 205 2.7 0.68
CS-ZN-PAN-M4-12 M4 12 Carbon Steel Zinc-Plated Pan Head Phillips M4x0.7 Zinc-Plated 730 450 3.1 0.75
CS-ZN-HEX-M6-20 M6 20 Carbon Steel Zinc-Plated Hex Head Hex M6x1.0 Zinc-Plated 800 480 4.2 1.80
SS316-CNTR-M4-10 M4 10 Stainless Steel 316 Bright Countersunk Phillips M4x0.7 None 640 380 2.9 0.72
AL6061-BTN-M5-8 M5 8 Aluminum 6061-T6 Anodized Button Torx M5x0.8 Anodized 320 170 1.2 0.31
ST304-PAN-M3-6 M3 6 Stainless Steel 304 Satin Pan Head Phillips M3x0.5 None 520 205 1.6 0.22

Related Products

banner (3)

Making self-tapping screws Market Leader Where Innovation Meets 2025

Annual R&D Investment by Year in the Self-Tapping Screws Sector

Explanation: This bar chart presents annual R&D investment values (in USD millions) allocated to product and process innovation in the self-tapping screws sector from 2018 to 2024. The values are illustrative, chosen to reflect a growth trajectory common in specialized manufacturing where incremental innovations yield competitive advantages. The visualization employs a single dimension—investment amount—across discrete years, making it easy to compare year‑over‑year commitments to research and development. The chart uses a consistent scale (0 to 50 million USD) to ensure bars are comparable and to highlight proportionate increases. The series starts modestly in 2018, grows in 2019, and continues with a stronger increase from 2020 onward, culminating in the highest investment in 2024. This pattern may parallel the maturation of design tools, testing capabilities, and supply-chain collaborations that enable faster prototyping and more rigorous performance validation. The relatively larger jump between 2022 and 2024 could reflect intensified competition, escalating material performance standards, and a shift toward lightweight, corrosion-resistant fasteners that require deeper R&D. Notes: The data in this example is synthetic and intended for demonstration; it does not reflect any specific company or real forecast. In practice, investors and executives would complement this view with additional dimensions such as output metrics (e.g., patents filed, prototypes advanced, time-to-market), ROI indicators, and efficiency gains from automation. The current visualization intentionally emphasizes absolute investment magnitudes to facilitate quick cross-year comparisons; adding secondary metrics would require a multi-series chart or a dual-axis design to avoid clutter while preserving clarity. Potential extensions include plotting R&D intensity (investment relative to revenue or production volume), or overlaying success signals like yield improvements or defect rates. Overall, the chart communicates the scale and direction of innovation funding, offering a concise snapshot of how attention and resources shift across years in a technology-driven fastener segment. Interpreting this chart should consider macroeconomic factors, commodity price volatility, and customer cycle trends that influence R&D planning.

Top Selling Products