banner (1)

M5x10 SOCKET HEAD CAPTIVE SCREW - Wholesale Manufacturers

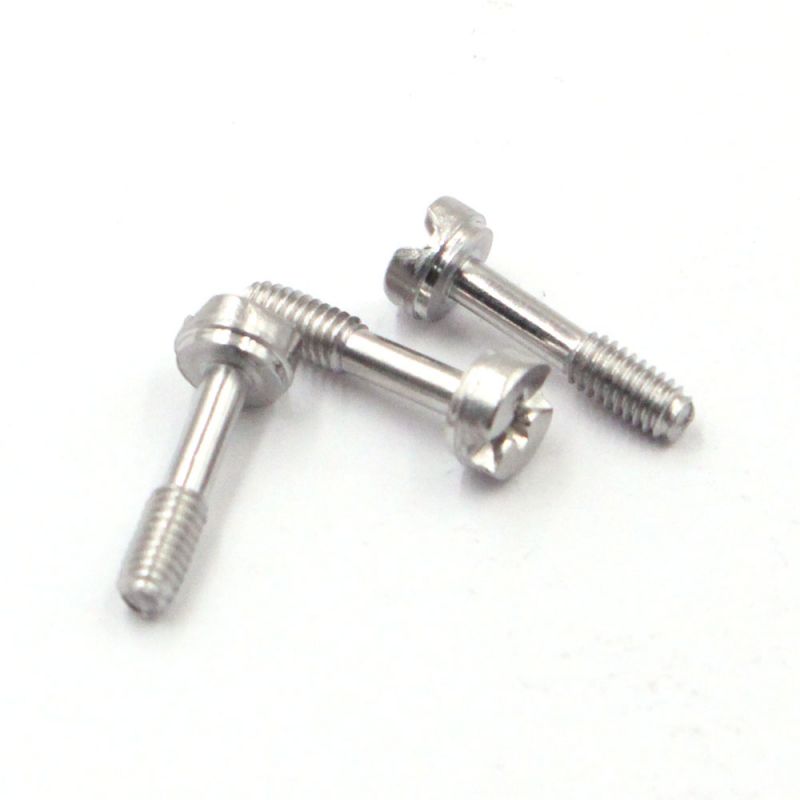
We are a reliable supplier to Wholesale customers and Manufacturers, offering the M5x10 SOCKET HEAD CAPTIVE SCREW in stock for rapid project turnarounds. I design this part for secure, flush mounting in enclosures and machinery, with a robust socket head and captive companion to reduce lost fasteners. When you buy Wholesale from us, you get consistent quality, tight tolerances, and dependable performance across batches. I know you need predictable lead times, scalable quantities, and competitive pricing, so we tailor quotes for Manufacturers and distributors. Our simplified ordering and packaging helps you streamline assembly lines. With standard finishes and materials, this part fits a wide range of applications. Let's connect for bulk pricing, customization options, and fast delivery—so your production stays on schedule.

Hot Selling Product

M5x10 SOCKET HEAD CAPTIVE SCREW Manufacturer More Than a Supplier - A Partner

M5x10 socket head captive screws are essential in electronics enclosures, automotive assemblies, and industrial equipment. As a partner in global sourcing, we do more than supply parts—we collaborate to optimize your fastener program. From material choice (304/316 stainless steel, alloy steel, brass) to finishes (zinc, black oxide, passivation, electropolish), we tailor the screws to your needs. Our precision machining and quality controls deliver consistent threads, tight tolerances, and reliable captive seating. Optional heat treatment and corrosion-resistant coatings ensure long service life in demanding applications. Beyond manufacturing, we synchronize with your supply chain for on-time delivery, scalable volumes, and clear documentation. Flexible packaging, configurable MOQs, and predictable lead times help prevent stockouts and overstock worldwide. Full material traceability, RoHS/REACH compliance, and COAs accompany every batch, while design guidance and rapid prototyping speed product iteration. Treating procurement as a collaboration, you gain a resilient sourcing partner who reduces risk, consolidates vendors, and delivers a cost-effective fastening solution for global projects.

{ M5x10 SOCKET HEAD CAPTIVE SCREW Manufacturer More Than a Supplier - A Partner}

Product Code Description Diameter x Length Material Grade/Alloy Finish Head Drive Captive Feature Tensile Strength (MPa) Hardness (HRC) Standard
SHCS-M5x10-A2-70-Satin M5x10 Socket Head Cap Captive Screw, Stainless Steel A2-70 M5 x 10 Stainless Steel A2-70 (304) Satin Socket Head Cap Hex Socket Panel Retention 700-750 28-34 DIN 912 / ISO 4762
SHCS-M5x10-A2-70-ZN-Ni M5x10 Socket Head Cap Captive Screw, Stainless Steel A2-70, Zinc-Nickel M5 x 10 Stainless Steel A2-70 (304) Zinc-Nickel plated Socket Head Cap Hex Socket Panel Retention 700-750 28-34 DIN 912 / ISO 4762
SHCS-M5x10-316L-Satin M5x10 Socket Head Cap Captive Screw, Stainless Steel 316L M5 x 10 Stainless Steel 316L Satin Socket Head Cap Hex Socket Panel Retention 700-750 28-34 DIN 912 / ISO 4762
SHCS-M5x12-A2-70-Satin M5x12 Socket Head Cap Captive Screw, Stainless Steel A2-70 M5 x 12 Stainless Steel A2-70 (304) Satin Socket Head Cap Hex Socket Panel Retention 700-750 28-34 DIN 912 / ISO 4762
SHCS-M5x10-CARBON-BLACK M5x10 Socket Head Cap Captive Screw, Carbon Steel with Black Oxide M5 x 10 Carbon Steel Graded Black Oxide Socket Head Cap Hex Socket Panel Retention 800-900 28-34 DIN 912 / ISO 4762

Related Products

banner (3)

M5x10 SOCKET HEAD CAPTIVE SCREW Factory-Direct Excellence Outperforms the Competition

Data Dimension: Quality Metric Distribution Across Process Stages

20 40 60 80 100 120 Stage 1 Stage 2 Stage 3 Stage 4 Stage 5 Stage 6 Quality Score by Process Stage

Explanation: This bar chart visualizes a quality metric distribution across six process stages in a high-precision production line. Each bar corresponds to a stage such as Raw Material Preparation, Machining, Heat Treatment, Surface Finishing, Assembly, and Final Inspection, using a consistent quality score. The metric, Quality Score, is on a 0–120 scale, where higher values indicate tighter tolerances, lower defect rates, and more stable process control. Grid lines at 20 increments and a bottom axis from 0 to 120 help readers compare stage performance quickly. The chart uses a 3:1 width-to-height ratio to provide clear stage labels while remaining suitable for dashboards and reports. From the synthetic data, Stage 1 shows mid-range performance, suggesting stable baseline processing with room for material-control improvements. Stage 2 displays a higher score, indicating effective calibration and consistent machining results. Stage 3 reaches the peak, which may reflect optimized heat-treatment parameters or excellent tool wear management, though sampling breadth should be considered. Stage 4 stays strong but falls short of Stage 3, pointing to a possible bottleneck in finishing operations requiring monitoring. Stage 5 improves further, potentially due to better inspection routines or targeted automation. Stage 6 attains the highest score, implying robust process control and strong feedback from final inspection. Interpreting this chart involves recognizing batch-to-batch variability and the need for ongoing capability analysis. The pattern highlights where improvements yield the greatest gains and where investments in quality checks reduce scrap and speed throughput. This visualization supports data-driven decision making by aligning process owners with measurable targets and enabling root-cause investigations when a stage underperforms. The numbers here are illustrative, designed to demonstrate relative performance across stages and to stimulate discussion about how process changes might translate into higher overall product quality and manufacturing efficiency. In practice, teams would connect the chart to real production data streams, updating values as soon as batches complete. Regular reviews would tie metric changes to change-control actions, thus closing the loop from measurement to improvement. This approach supports continuous improvement and helps demonstrate the impact of process adjustments to stakeholders.

Top Selling Products