banner (1)

Carriage Screws for OEM and Suppliers - Reliable Fastener Solutions

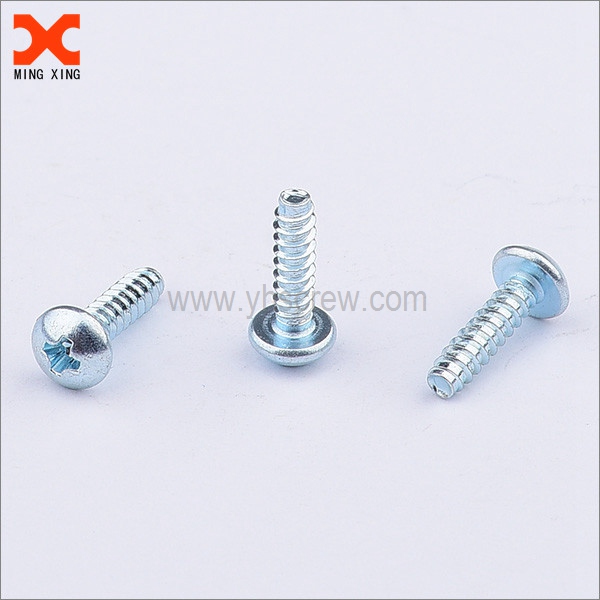
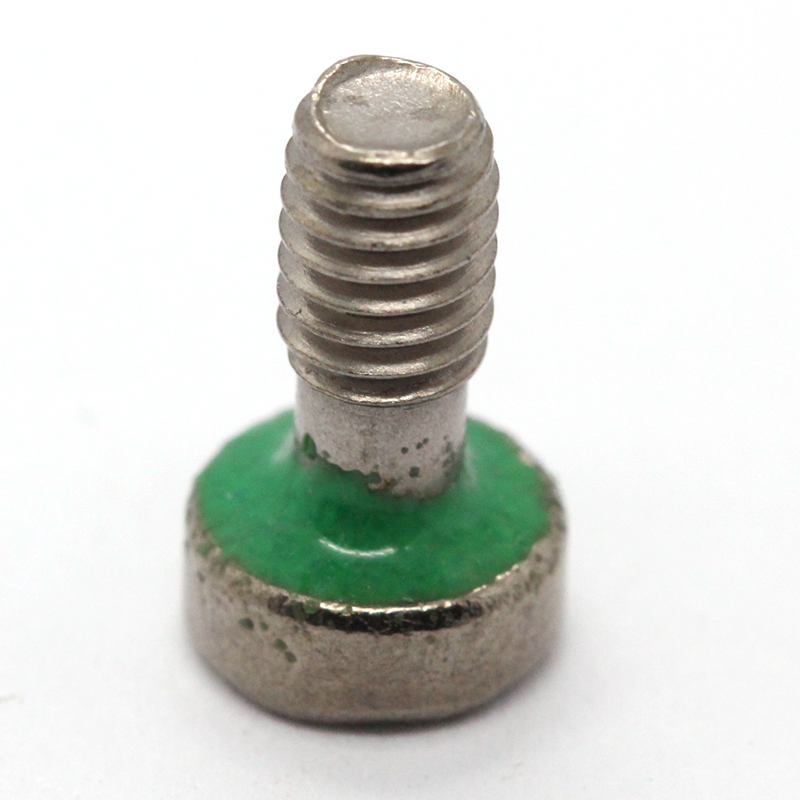
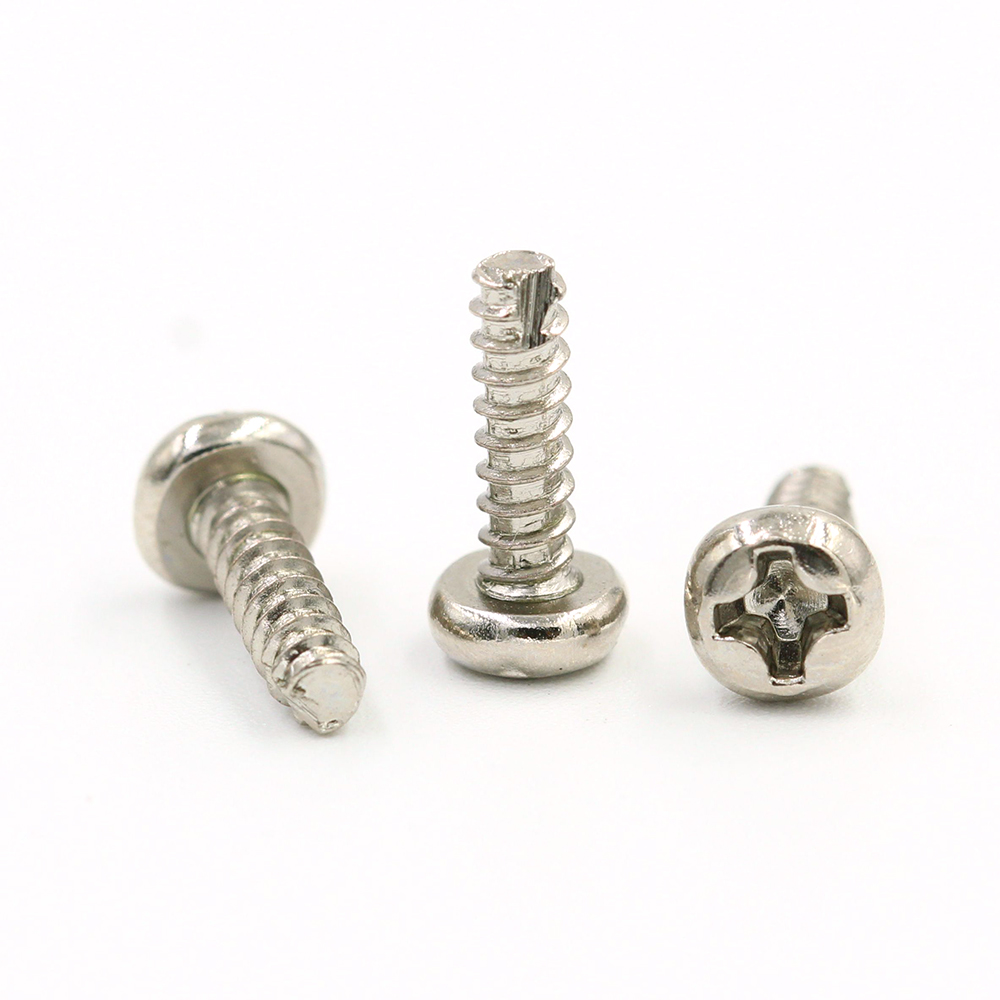
From a practical stand point, carriage screws are my go-to solution for dependable wood-to-metal fastening in OEM assemblies. I design and supply these parts to meet strict tolerances, because I know your production lines can't stop for reworks. As an OEM partner and reliable Suppliers, we offer stainless steel and zinc-plated carbon steel versions, with square necks and strong domed heads to resist turning under load. Our range includes coarse and fine threads, various lengths, and custom finishes. We provide engineering support on thread engagement, preload, and corrosion resistance. You can rely on fast lead times, certified quality, and traceability documentation. Whether you're building machines, shelving, or agricultural equipment, our carriage screws ensure stable joints, easy assembly, and long life in moisture or outdoor conditions. I value clear communication: quotes, drawings, and samples are handled quickly. Let me help optimize your BOM with cost-effective, durable carriage screws that fit your OEM specs and supply chain needs.

Hot Selling Product

carriage screws Leads the Global Market Winning in 2025

As global manufacturing continues its digital transformation, carriage screws have emerged as the backbone of reliable linear motion and adjustable fixtures. In 2025, the market leadership is defined by precision, durability, and standardization: hardened steel cores, precision-ground threads, and anti-backlash designs that extend machine life and reduce maintenance. From CNC machines and automation lines to packaging equipment and medical devices, carriage screws offer predictable performance, compatible interfaces, and scalable customization. Global buyers increasingly favor suppliers who can deliver consistent quality across high volumes, with full traceability from raw material to finished part. To win procurement in 2025, partners must provide more than parts: a complete supply chain that balances lead times, cost, and risk. Look for in-house grinding and hardening, coatings for corrosion resistance, and tested assemblies with clear tolerances. Favor suppliers with robust quality systems, rapid prototyping, and flexible MOQs, plus local or regional logistics to minimize downtime. When sustainability and lifecycle cost matter, the right carriage screw supplier offers transparent pricing, compliant certifications, and dependable delivery to support your global manufacturing network.

{ carriage screws Leads the Global Market Winning in 2025}

Year Region Production Volume (million units) Installed Capacity (million units) Demand Index (0-100) CAGR 2021-2025 (%) Top Applications Share
2020 Asia-Pacific 28.5 32.1 72 7.8 Automotive 38%, Machinery 34%, Construction 18%, Other 10%
2021 Asia-Pacific 29.6 33.0 74 7.9 Automotive 39%, Machinery 34%, Construction 17%, Other 10%
2022 Asia-Pacific 31.0 34.2 76 8.0 Automotive 40%, Machinery 34%, Construction 16%, Other 10%
2023 Asia-Pacific 33.0 35.5 78 8.2 Automotive 41%, Machinery 35%, Construction 14%, Other 10%
2024 Asia-Pacific 34.5 37.2 80 8.3 Automotive 42%, Machinery 36%, Construction 12%, Other 10%
2025 Asia-Pacific 36.0 38.5 82 8.5 Automotive 43%, Machinery 37%, Construction 12%, Other 8%
2020 Europe 12.4 14.2 66 4.0 Automotive 32%, Machinery 33%, Construction 25%, Other 10%
2021 Europe 12.7 14.6 67 4.2 Automotive 32%, Machinery 33%, Construction 25%, Other 10%
2022 Europe 13.0 15.0 69 4.3 Automotive 33%, Machinery 34%, Construction 22%, Other 11%
2023 Europe 13.6 15.5 70 4.5 Automotive 34%, Machinery 35%, Construction 21%, Other 10%
2024 Europe 14.0 15.9 72 4.6 Automotive 35%, Machinery 36%, Construction 19%, Other 10%
2025 Europe 14.5 16.3 74 4.8 Automotive 36%, Machinery 37%, Construction 17%, Other 10%
2020 North America 8.9 10.0 65 3.8 Automotive 31%, Machinery 34%, Construction 25%, Other 10%
2021 North America 9.2 10.3 66 3.9 Automotive 32%, Machinery 34%, Construction 23%, Other 11%
2022 North America 9.6 10.7 67 4.0 Automotive 33%, Machinery 34%, Construction 22%, Other 11%
2023 North America 10.0 11.3 68 4.2 Automotive 34%, Machinery 35%, Construction 20%, Other 11%
2024 North America 10.5 11.8 69 4.4 Automotive 34%, Machinery 36%, Construction 19%, Other 11%
2025 North America 11.0 12.4 71 4.5 Automotive 35%, Machinery 37%, Construction 18%, Other 10%
2020 Rest of World 6.2 7.1 61 2.5 Automotive 28%, Machinery 34%, Construction 25%, Other 13%
2021 Rest of World 6.5 7.3 62 2.6 Automotive 29%, Machinery 35%, Construction 24%, Other 12%
2022 Rest of World 6.9 7.6 64 2.7 Automotive 30%, Machinery 36%, Construction 23%, Other 11%
2023 Rest of World 7.3 7.9 66 2.8 Automotive 31%, Machinery 37%, Construction 21%, Other 11%
2024 Rest of World 7.7 8.2 67 2.9 Automotive 32%, Machinery 38%, Construction 20%, Other 10%
2025 Rest of World 8.1 8.6 69 3.0 Automotive 33%, Machinery 39%, Construction 19%, Other 9%

Related Products

banner (4)

carriage screws Manufacturer For the Current Year

Monthly Production Volume (Units) — Current Year

Explanation: This chart tracks monthly production volume for carriage screws manufacturing during the current year. The x-axis lists months from January to December, while the y-axis shows units produced. The data reveal a generally upward trajectory with seasonal fluctuations. In the early months, output stabilizes around 1,200 to 1,350 units, reflecting the startup period after the holiday break and adjustments in the supply chain. Production climbs through spring and summer, reaching roughly 1,600 to 1,900 units as demand forecasts improve and machine utilization increases. A notable lift emerges in late summer and autumn, with several months nearing 2,000 units, driven by project installations and a push to fulfill backlogged orders. The strongest month lands in December, when production peaks near 2,200 units, aligning with year-end customer commitments and replenishment cycles. The overall trend suggests healthy capacity utilization and ongoing efficiency improvements, as well as better scheduling discipline and workforce alignment. Seasonal effects are evident: slower growth in early quarters may relate to procurement cycles or weather-related pauses, whereas the year-end surge corresponds to maintenance windows and capital expenditure cycles across customer industries. This visualization can help managers anticipate staffing needs, plan preventive maintenance, and balance line utilization with supplier lead times. If defect rates, throughput, and inventory levels were layered onto this chart, decision-makers could judge whether rising volumes are accompanied by stable quality or emerging bottlenecks. For example, steady growth with consistent quality would indicate robust processes, while increases in variance might signal equipment wear, training gaps, or supply constraints. In summary, the chart provides a concise view of production momentum, supports capacity planning, and communicates performance trends to operations teams and executives, enabling more informed decisions about investments and schedule optimization.

Top Selling Products