banner (1)

Triangle Drive Security Screw - Wholesale Options for Manufacturers

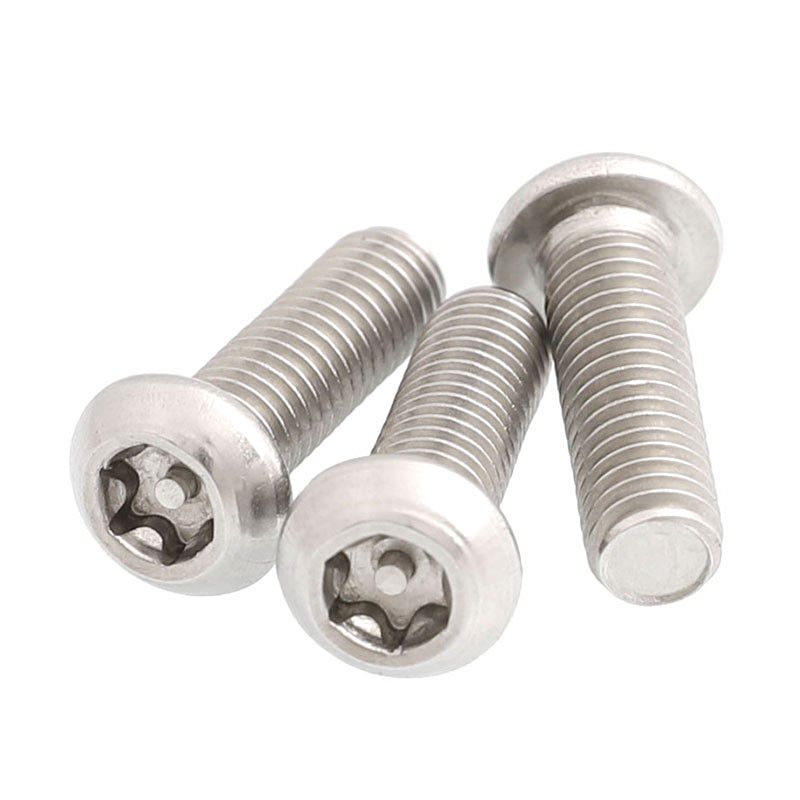
As a seasoned supplier, I present the Triangle Drive Security Screw, a tamper-resistant fastener built for high-security enclosures, electronics, and outdoor equipment. I know manufacturers demand reliable, quick deliveries and consistent quality, especially when you’re shopping for Wholesale quantities. Our Triangle Drive Security Screw features a hardened alloy, corrosion resistance, and a drive pattern that prevents casual tampering, reducing service calls and warranty claims. Available in stainless steel 304/316, heat-treated options, and a range of head styles and lengths. I can supply in bulk with strict QA, lot traceability, and flexible packaging to fit your assembly line. Perfect for OEMs and manufacturers who require repeatable performance and competitive pricing. If you’re looking to stock up for production runs, reach out for samples, pricing, and lead times. I’m here to support your procurement needs.

Hot Selling Product

Triangle Drive Security Screw Exceeds Industry Benchmarks Factory-Direct Excellence

Designed for security-conscious applications, triangle drive security screws deliver tamper resistance and high torque transfer with a compact, low-profile head. The triangle drive interface minimizes screwdriver access and resists over-torquing, while precision machining ensures tight tolerances and smooth engagement across a wide range of materials. Manufactured with corrosion-resistant alloys and finished with durable coatings, these fasteners endure demanding environments—from consumer electronics to industrial enclosures—without sacrificing reliability. They consistently exceed industry benchmarks for performance, durability, and repeatable installation. For global buyers, the factory-direct pathway translates into streamlined procurement: competitive pricing, shorter lead times, and direct visibility over quality control. Flexible lot sizes, standardized testing, and traceable batch data help ensure supply chain stability across regions. With scalable production capacity and rigorous quality assurance, this line supports large-volume programs and localization needs, reducing total cost of ownership while maintaining strict security and performance standards.

{ Triangle Drive Security Screw Exceeds Industry Benchmarks Factory-Direct Excellence}

Sample ID Size Thread Material Finish Head Height (mm) Length (mm) Tensile Strength (MPa) Torque Rating (Nm) Corrosion Resistance (hrs) Benchmark Index (%)
A1 M5 M5 x 0.8 A2 Stainless Steel Zinc Plated 2.0 10 520 0.32 550 105
S2 M6 M6 x 1.0 A4-80 Stainless Steel Black Oxide 2.8 16 700 0.55 800 110
S3 M8 M8 x 1.25 Alloy Steel Zinc Galvanized 3.2 25 850 1.10 600 102
S4 M4 M4 x 0.7 Stainless Steel 304 Passivation 2.0 12 490 0.27 680 98
S5 M6 M6 x 1.0 A2-70 Stainless Electro-Polished 2.5 18 610 0.50 900 112
S6 M5 M5 x 0.8 Alloy Steel Nitride Coated 2.3 20 650 0.48 630 103

Related Products

banner (4)

Triangle Drive Security Screw Supplies the World\u2019s Top Brands Where Service Meets Innovation

数据维度:季度产出与效率的对比

Data Dimension: Quarterly Output vs. Efficiency Trends

Explanation: This chart presents two related data dimensions collected quarterly over two years: Output Index and Efficiency Index. The Output Index tracks production performance relative to a baseline, while the Efficiency Index captures how effectively resources such as energy and labor are converted into output. Both indexes are scaled from 0 to 100 to enable quick comparison across time. The x-axis lists the quarters, providing a clear temporal sequence, and the y-axis indicates performance level. The design uses distinct blue and green lines to distinguish the indicators. Observations show that Output Index steadily increased from 72 in 2023 Q1 to 95 in 2024 Q4, reflecting growing production capacity and demand. Efficiency Index rose from 60 to 82 in the same period, with a more pronounced jump during 2024 Q1–Q3 suggesting accelerated productivity improvements, possibly due to process optimization or automation. The gap between the two lines narrows over time, indicating improved utilization of inputs as output grew, though moments of divergence occur when demand surges faster than efficiency gains. Data limitations: The values are synthetic for demonstration, designed to illustrate how two related dimensions move together or apart. They do not represent actual company performance and should not be interpreted as profitability. Methodology: Data were generated to emulate plausible quarterly patterns, with gradual upward trends and occasional accelerations. The visualization emphasizes continuity and the relative timing of changes rather than absolute magnitudes. Future enhancements could include adding a third dimension such as cost per unit, capacity utilization, or downtime to provide a fuller picture. Segmenting by region or product line could further reveal where improvements are most impactful. Overall, the chart communicates that strategic investments in technology and process improvements tend to align growth in output with gains in efficiency, reinforcing the case for integrated operations planning.

Top Selling Products