banner (1)

T Bolts | ODM Factory | Custom Bolt Solutions

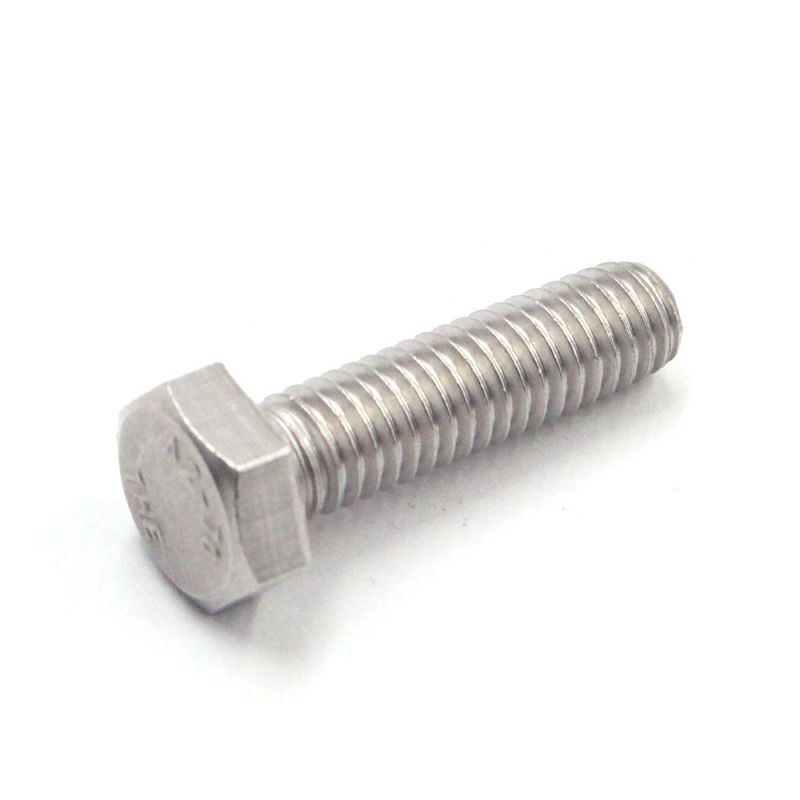
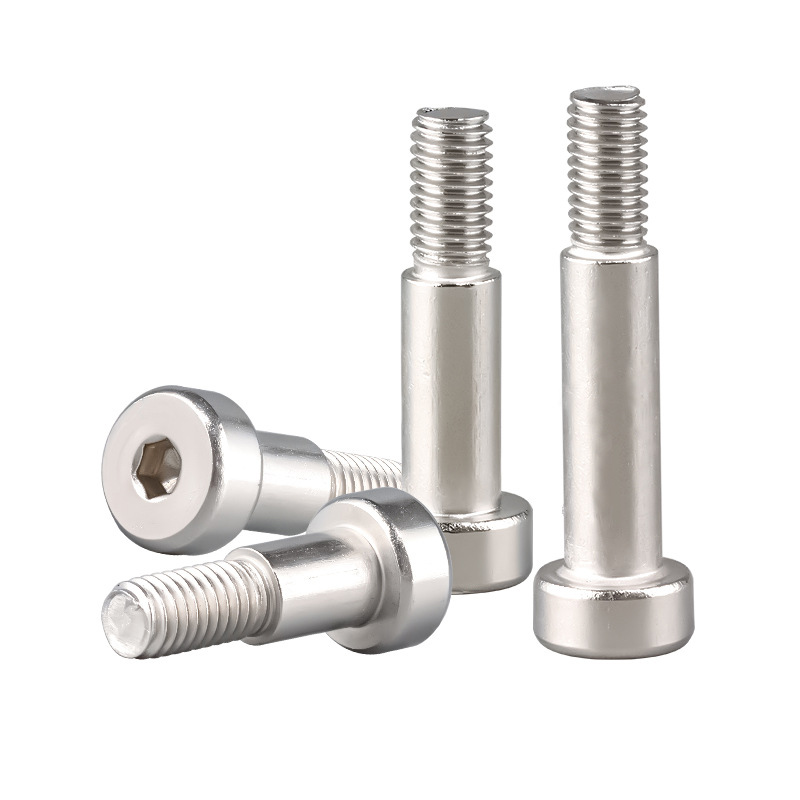
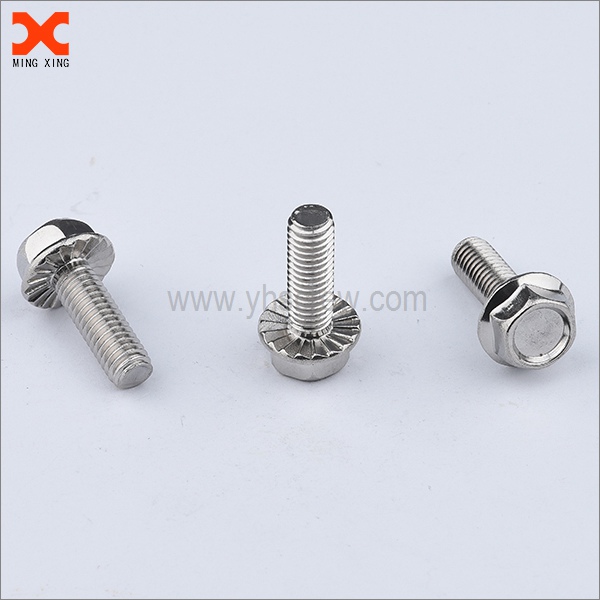
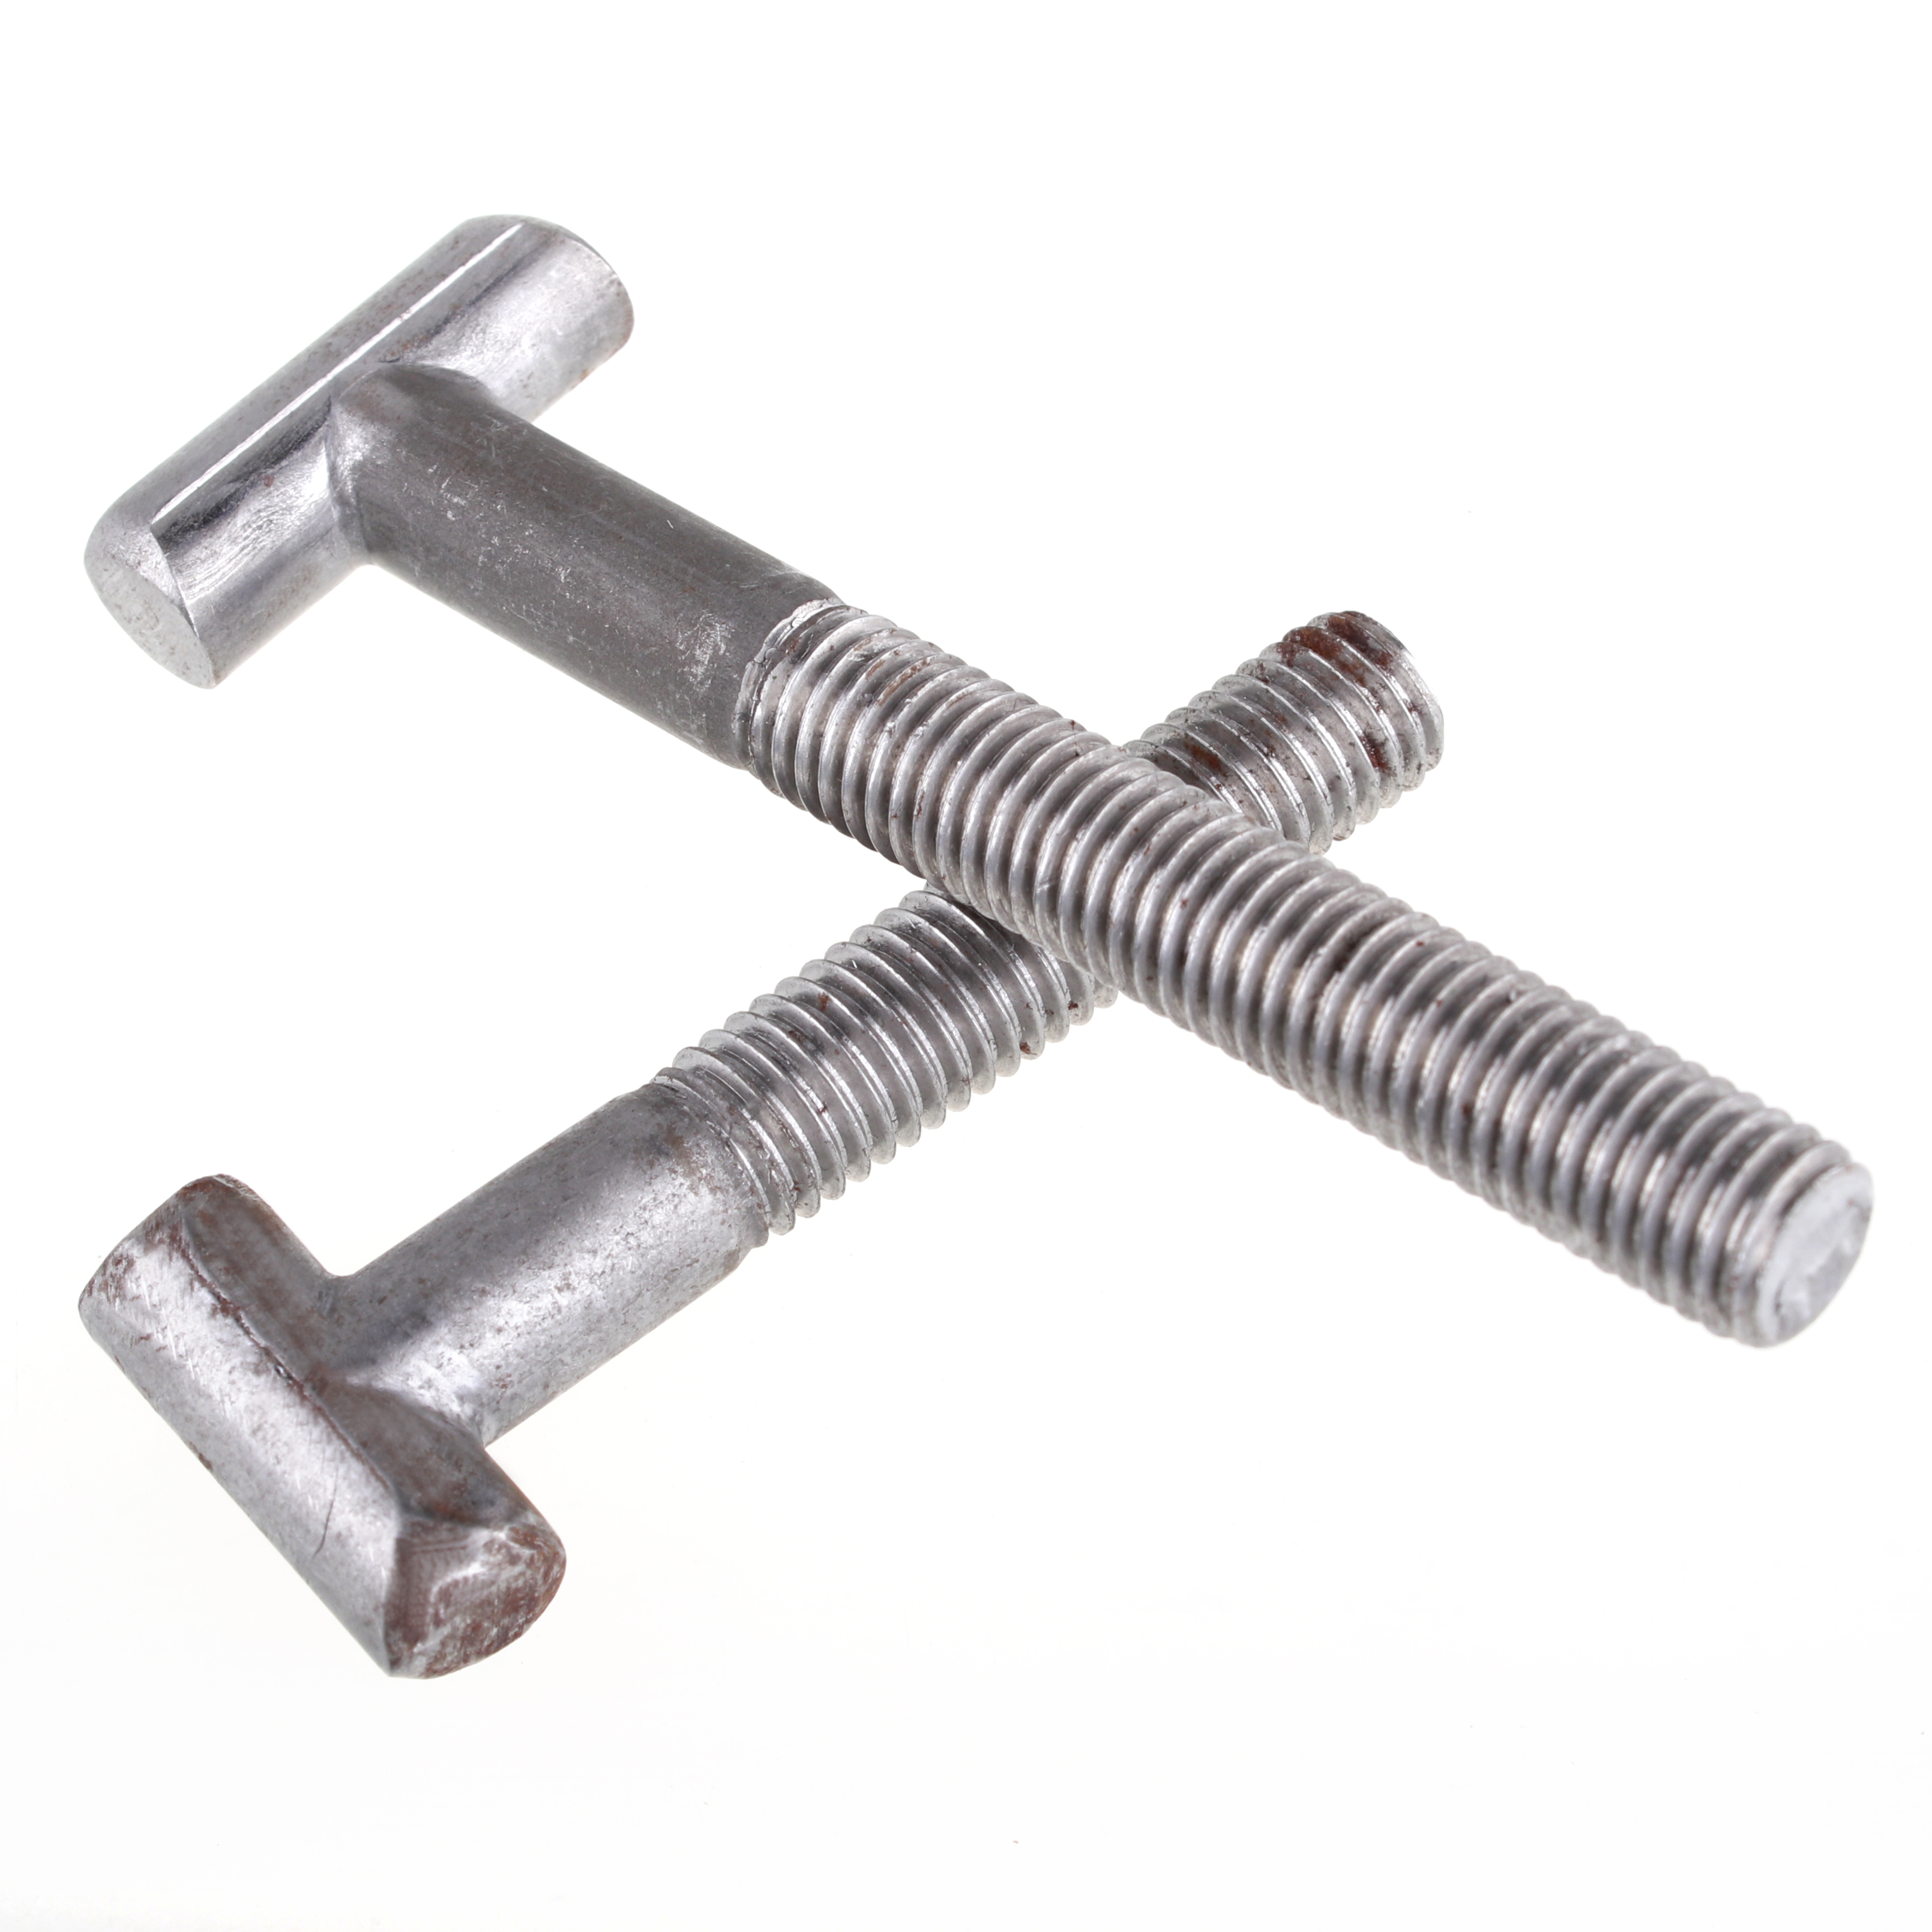
From my side, I supply {T Bolts} that lock securely into T-slots for fast, vibration-resistant mounting. With the flexibility of {ODM} and our {Factory} setup, I tailor dimensions, thread types, and finishes to meet your spec. My team uses chrome plated or stainless finishes, corrosion resistant, heat-treated for strength. These {T Bolts} fit standard aluminum extrusion profiles and provide reliable clamping in automation lines, fixtures, and machinery assemblies. I offer rapid sample testing and scalable production to support both prototype runs and full-scale manufacturing. Lead times are short, and QA includes dimensional inspection, plating thickness, and torque testing. I pride myself on clear documentation: material certifications, BOM, and technical drawings. If you need different head shapes or thread pitches, I can adjust quickly. Consider these for ODM or factory-grade supply, with consistent quality, competitive pricing, and friendly service that understands your supply chain.

Hot Selling Product

T Bolts Manufacturer Your End-to-End Solution

As a T bolts manufacturer offering an end-to-end solution, we support global buyers from concept to final assembly. Our in-house capabilities cover design consultation, material selection, precision forging, heat treatment, and durable surface finishes. We provide tight tolerances, rapid prototyping, and rigorous inspection to ensure fit with your assemblies before full production. This integrated approach shortens lead times, reduces risk, and delivers consistent quality at scale. Partnering with a single source for all stages simplifies procurement across borders. We maintain full traceability, material certificates, and compliance with international standards. From packaging and labeling to global logistics and on-time delivery, we tailor solutions to your destination and schedule. With scalable production, flexible MOQs, and proactive quality management, your purchasing remains reliable, transparent, and cost-efficient.

{ T Bolts Manufacturer Your End-to-End Solution}
Product Code Category Material Diameter (mm) Length (mm) Thread Pitch Standard Finish Tensile Strength (MPa) Lead Time (days) Monthly Capacity Defect Rate (%)
TB-HEX-01 T-Bolt Hex Head Alloy steel AISI 4140 8.0 35 M8x1.25 ISO 898-1 Zinc-Nickel 850 4 500000 0.6
TB-HEX-02 T-Bolt Square Head Stainless steel AISI 304 10.0 40 M10x1.5 ISO 898-1 Passivation 520 3 450000 0.5
TB-SH-01 T-Bolt Shoulder Carbon steel 1022 12.0 50 M12x1.75 ISO 898-1 Black oxide 700 5 320000 0.8
TB-SH-02 T-Bolt Standard Alloy steel 8620 16.0 60 M16x2.0 ISO 898-1 Zinc plating 920 6 280000 0.4
TB-HEX-03 T-Bolt Hex Head Stainless steel AISI 316 20.0 80 M20x2.5 ISO 898-1 Passivation 780 7 210000 0.7
TB-ALU-01 T-Bolt Hex Head Aluminum alloy 6061 6.0 25 M6x1.0 ISO 898-1 Anodized 320 2 400000 0.3
TB-HEX-04a T-Bolt Hex Head Carbon steel 1050 18.0 70 M18x2.0 ISO 898-1 Zinc plating 650 4 350000 0.6
TB-SS-01 T-Bolt Square Head Stainless steel AISI 304 22.0 95 M22x2.5 ISO 898-1 Bright zinc 650 9 140000 0.9
TB-HEX-05 T-Bolt High-Strength Tool steel D2 28.0 110 M28x3.0 ISO 898-1 Black oxide 1100 10 90000 0.5
TB-SS-02 T-Bolt Square Head Stainless steel AISI 316 14.0 45 M14x1.5 ISO 898-1 Passivation 700 5 260000 0.4

Related Products

banner (3)

T Bolts Factory Global Reach

Data Dimension: Global Reach by Market Region

2019 2020 2021 2022 2023 2024 0% 20% 40% 60% 80% 100% North America Europe Asia-Pacific Other Regions 2019 2020 2021 2022 2023 2024 Market Reach (%) Year

Explanation

This chart presents Global Reach by Market Region from 2019 through 2024, using a consistent 0–100 scale to reflect regional market penetration, distribution capability, or demand share as a percentage of a defined global capacity. The dataset here is synthetic for demonstration, designed to illustrate how regional penetration could evolve under a stable growth scenario. The data dimension is Global Reach by Market Region, highlighting how regional dynamics shape overall coverage and strategic planning. Observations show Asia-Pacific achieving the strongest growth, rising from about 25% in 2019 to roughly 68% in 2024, indicating rapid expansion in regional production, logistics, and market access. North America grows steadily from around 20% to about 50%, suggesting a mature but expanding market. Europe increases from roughly 15% to about 42%, reflecting gradual acceleration in market access. Other Regions climb from about 5% to near 18%, representing nascent but meaningful growth. These trends imply several strategic implications: Asia-Pacific may drive total reach, so investing in regional capacity and supply chains there could yield the largest gains; North America and Europe remain important for diversification, resilience, and balanced exposure; diversification into Other Regions helps spread risk. Methodology uses linear interpolation between annual points and a fixed scale for easy cross-region comparison. Caveats include the synthetic nature of the data, rounding of values, and the absence of currency effects, seasonality, regulatory changes, or absolute volumes. For a complete picture, combine this visualization with operational metrics such as production output, shipment volumes, and customer counts.

Top Selling Products