banner (1)

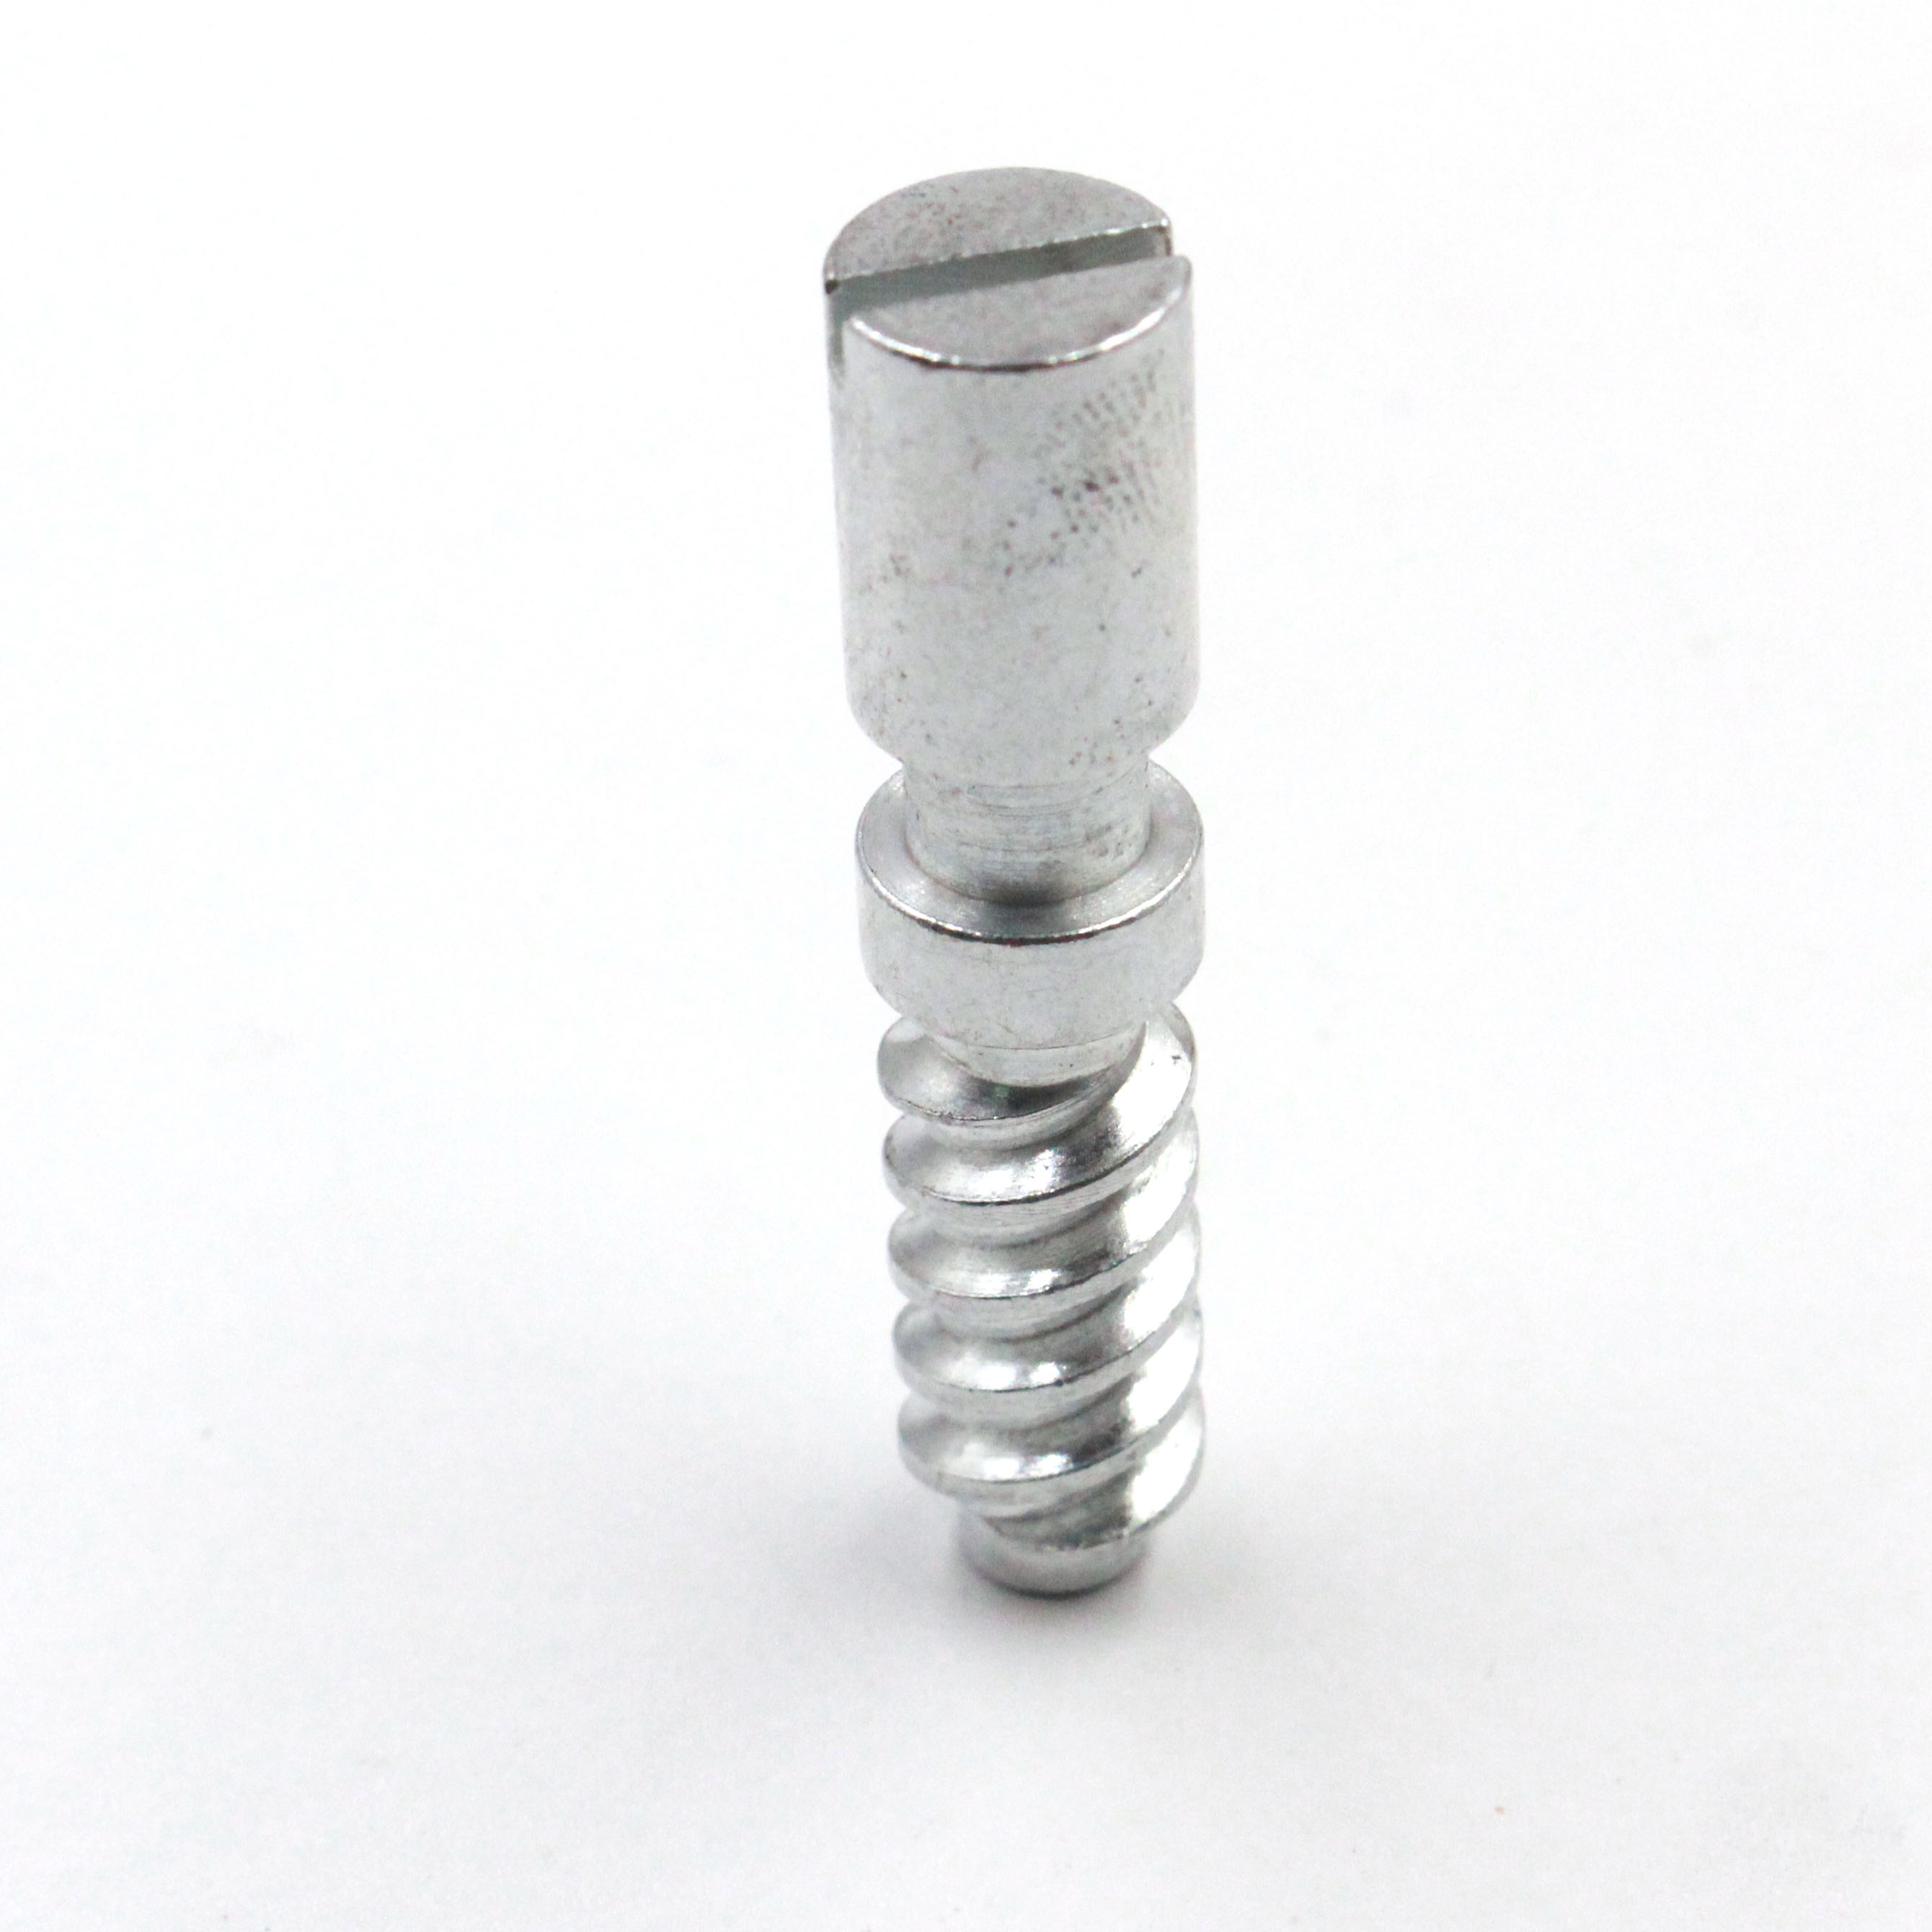
Precision Machined Pin - China Manufacturer for Industrial Components

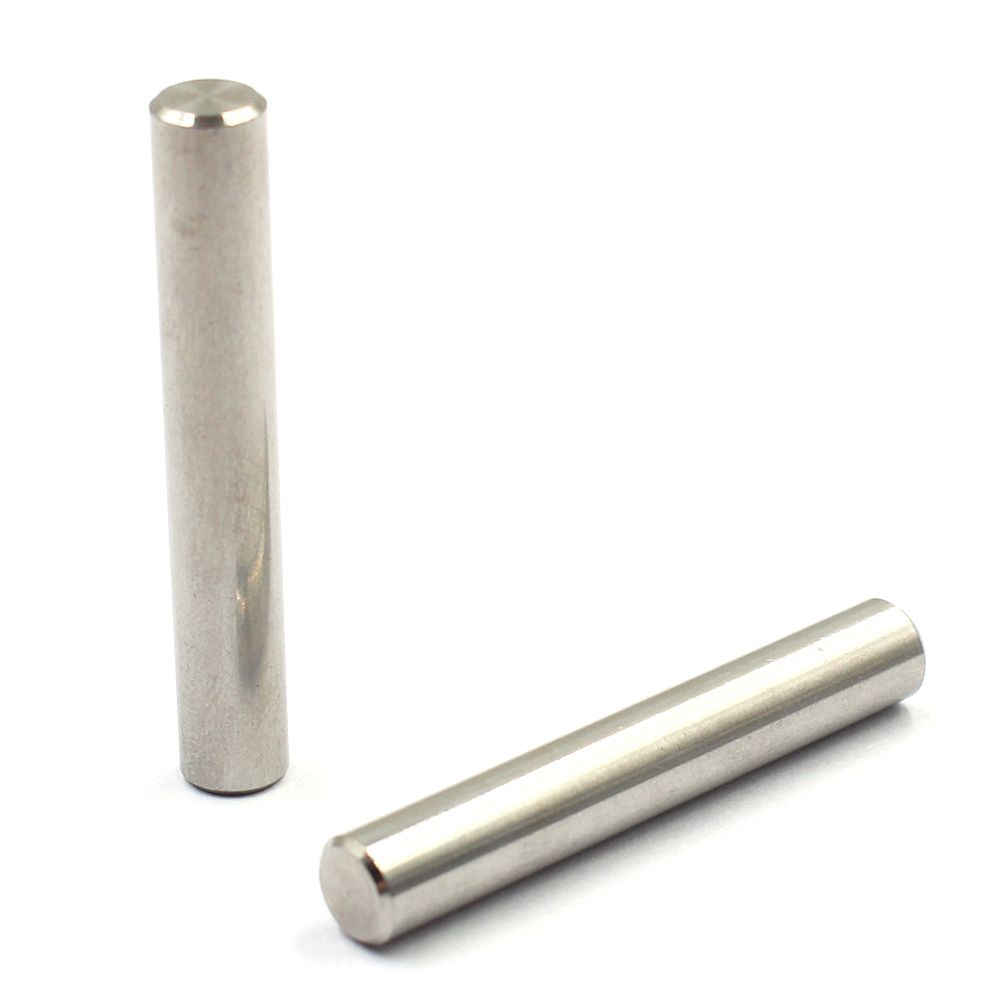
From our factory in China, I’m proud to offer the Precision Machined Pin that meets the demanding needs of OEMs and job shops. As a China-based Manufacturer, we deliver tight tolerances, polished finishes, and repeatable performance in fixtures, jigs, and automated equipment. Our pin is made from high-grade steel, with heat treatment and rigorous inspection to ensure roundness, straightness, and surface finish. We offer customization on diameter, length, head style, and coating to fit your application. We keep competitive pricing with short lead times and scalable production. We value traceability and provide certifications, first article inspection, and ISO 9001 quality management. If you need reliable supply chain and proactive service, we are your partner. Reach out to discuss your drawings, tolerances and material choice. We help you reduce risk and improve line uptime with consistent pin inventories.

Hot Selling Product

Precision Machined Pin Your Trusted OEM Partner Outperforms the Competition

As systems grow tighter, a precision machined pin is the backbone of reliable assemblies across electronics, automotive, medical, and industrial equipment. A trusted OEM partner in Dongguan brings deep capabilities in precision turning, grinding, heat treatment, and finishes to meet exact specs. Global buyers gain consistent geometry, stable tolerances, and reliable on-time delivery. Early design and manufacturing collaboration reduces risk, shortens ramp-up, and outpaces competitors through disciplined processes and responsive service. From materials to final inspection, the focus is repeatable quality and traceability. State-of-the-art equipment, precise controls, and tailored surface treatments deliver strength, corrosion resistance, and electrical performance. A robust quality system with 100% in-process checks, first article inspection, and batch traceability supports compliance for regulated industries. Flexible MOQs, scalable production, rapid prototyping, and efficient logistics enable global procurement teams to source precise pins at a competitive total cost of ownership, despite demand volatility or geography.

Precision Machined Pin Your Trusted OEM Partner Outperforms the Competition

Dimension Our Pin Competitor A Competitor B Industry Standard
Material Grade AISI 416 Stainless Steel AISI 316 Stainless Steel AISI 304 Stainless Steel AISI 304/416 range
Diameter Tolerance (mm) ±0.01 ±0.02 ±0.015 ±0.02
Surface Finish (Ra μm) 0.4 0.8 0.5 0.7
Straightness (mm per 100 mm) 0.02 0.04 0.03 0.03
Parallelism (μm) 6 12 10 8
Cp 2.0 1.6 1.8 1.9
Cpk 2.1 1.5 1.7 1.8
Defect Rate (%)* 0.012% 0.025% 0.018% 0.020%
Lead Time (days) 2.8 4.5 3.7 3.5
Dimensional Variation (Std Dev, μm) 4.2 8.1 6.0 5.0

Related Products

banner (3)

Precision Machined Pin Supplier More Than a Supplier - A Partner

Manufacturing Effectiveness by Pin Type

Dataset: simulated for demonstration. The bar heights represent a composite Manufacturing Effectiveness Score (0-100) for each pin type, derived from imagined lead time, quality yield, and throughput characteristics. Higher scores indicate a better overall balance of speed, precision, and reliability. The four pin types illustrate how small changes in process control, tolerance management, and inspection rigor can shift performance. Pin Type C achieves the highest score due to tight tolerance adherence and stable yields, while Pin Type D shows room for improvement in setup and inspection consistency. Pin Type A is well-balanced but slightly behind Type C due to marginally longer cycles. Pin Type B presents the lowest score, reflecting a combination of slower throughput and a modest increase in defects in this fictional scenario.

Explanation: This chart presents a synthetic dataset designed to illustrate how manufacturing effectiveness can be interpreted across different precision pin types. Each bar encapsulates a composite score on a 0–100 scale, derived from a simple model that combines lead time, defect rate, and throughput into a single index. The aim is to provide a consistent, comparable indicator that helps teams discuss tradeoffs and identify improvement opportunities without exposing sensitive production metrics. Pin Type A, Type B, Type C, and Type D were chosen to sample a range of process conditions, tooling configurations, and inspection rigor. Type A demonstrates solid performance with moderate cycle time, low variability, and acceptable defect levels; it achieves above-average effectiveness, signaling a mature process with room for optimization but low risk to delivery. Type B shows a modestly lower score, mainly driven by a longer cycle time and a slightly higher defect rate, reflecting a scenario where incremental efficiency gains could be realized through tool maintenance or process standardization. Type C reaches the highest score, reflecting highly consistent tolerance control, strong yields, and efficient throughput; this type represents an ideal balance and serves as a model for best practices that could be extended to other families. Type D trails due to higher setup variability and occasional quality excursions, suggesting opportunities for better work-in-process discipline, fixture design, or operator training. The chart supports qualitative discussion and quantitative tracking, enabling stakeholders to align on targets, allocate improvement initiatives, and monitor progress over time. In a real partnership, data would be updated with continuous telemetry, enabling dynamic benchmarking across shifts, suppliers, and material lots. This visualization supports decision-guided conversations about capability, risk, and customer value, reinforcing the idea that precision manufacturing is a collaborative, ongoing optimization effort. Developing such a score requires careful normalization and consensus on what matters most for customers: reliability, precision, and timely delivery. The scoring approach shown here emphasizes relative performance rather than absolute values, which helps maintain privacy while enabling meaningful comparisons. Users should interpret the bars in the context of targets and industry norms, and consider additional data such as tolerance distribution, first-pass yield, and scrap rate to form a complete picture.

Top Selling Products