banner (1)

M3 Self Tapping Nut - ODM Factory | Custom Solutions

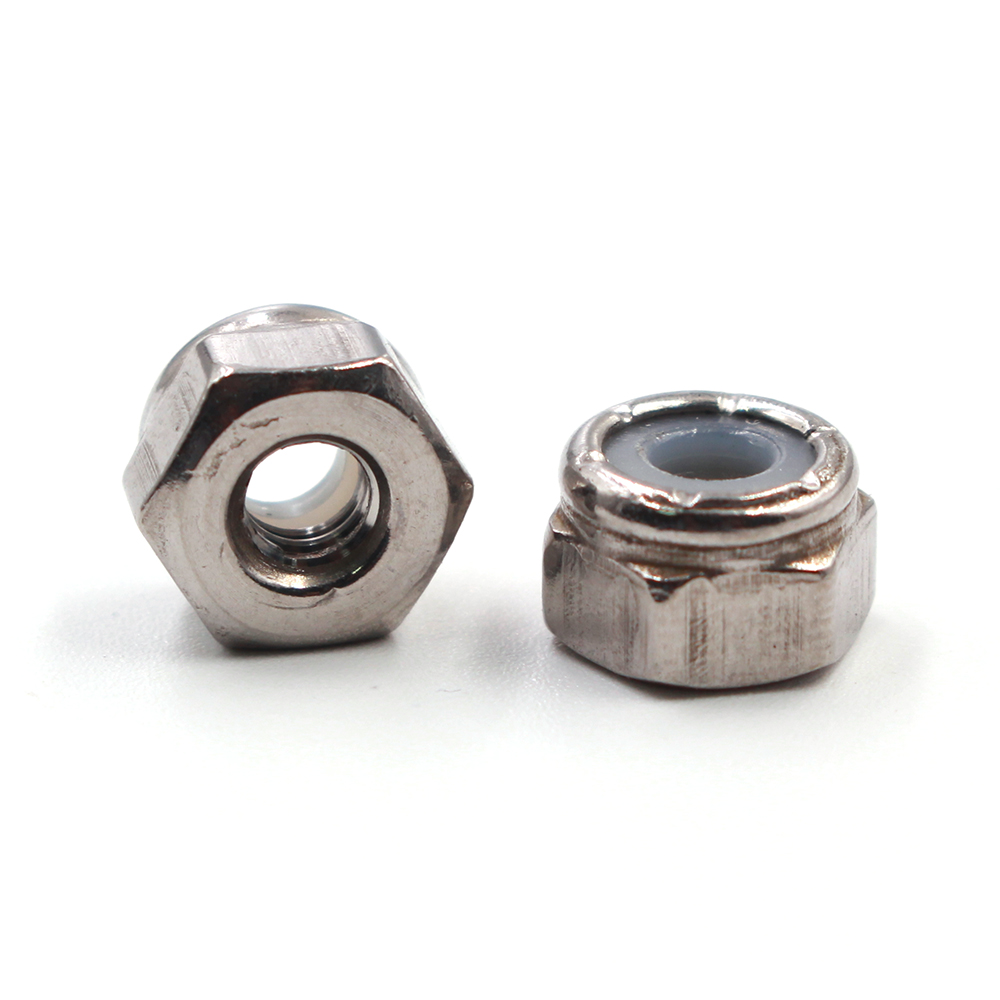
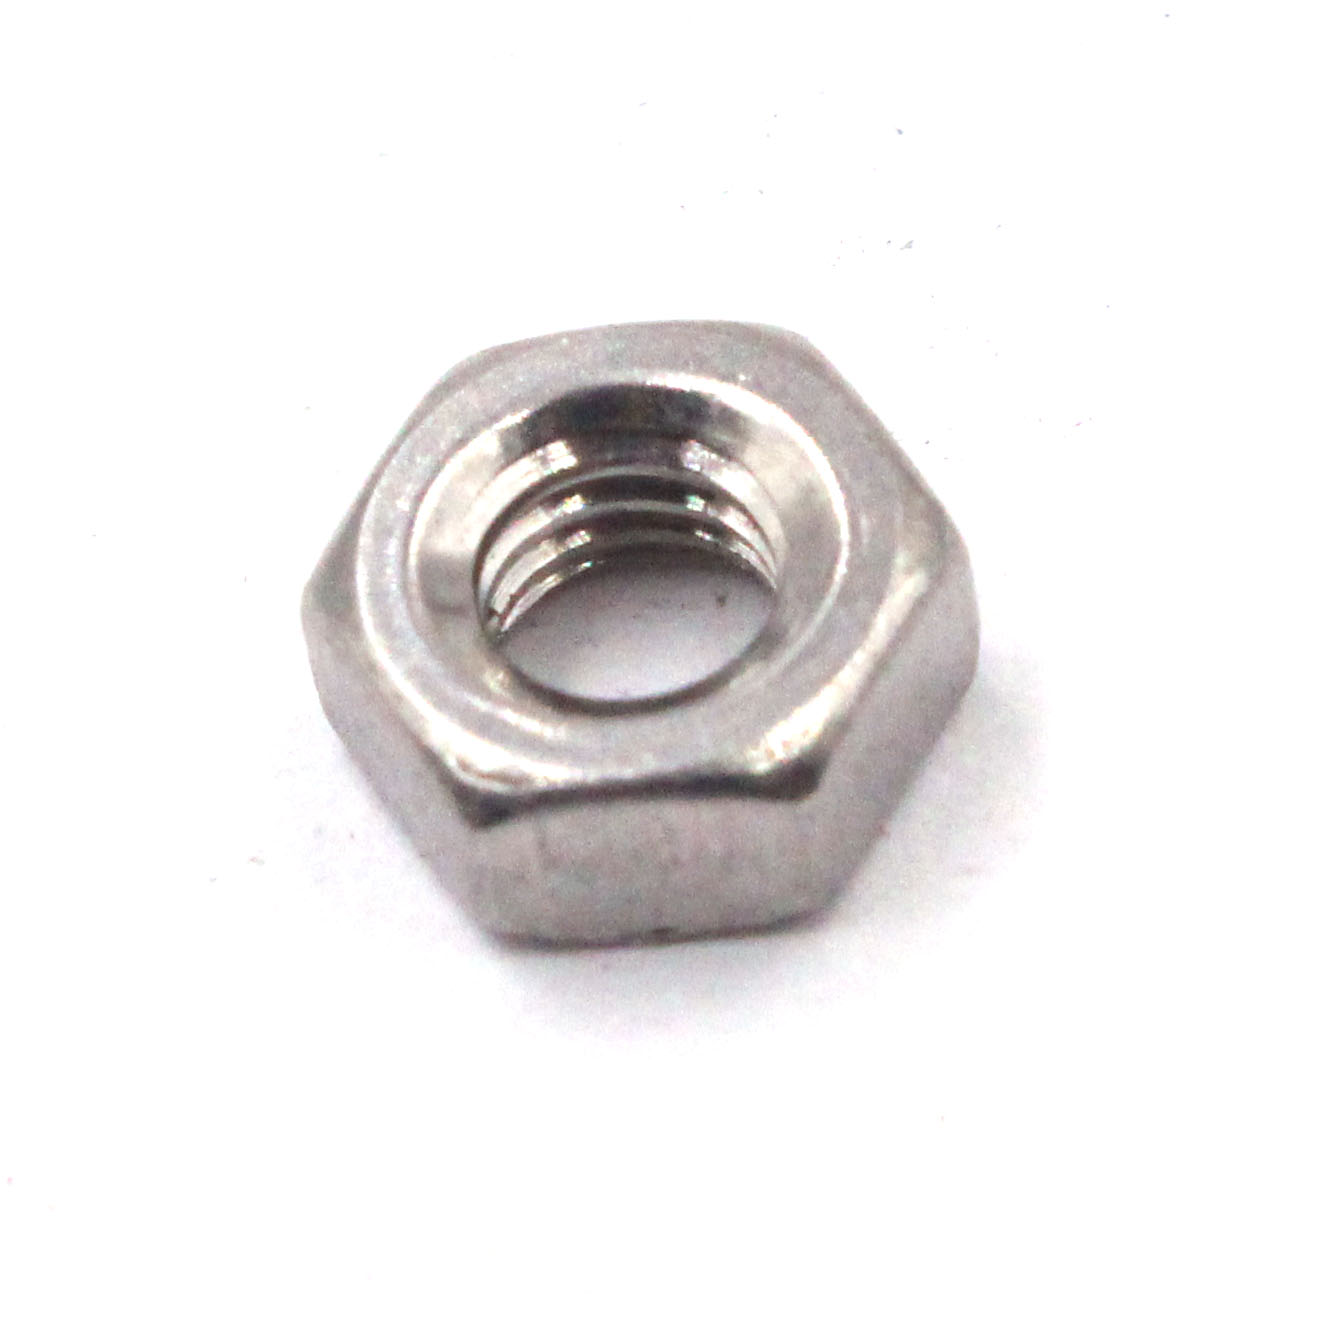
We manufacture the m3 self tapping nut with high torque performance and corrosion resistance, designed for fast assembly in thin materials. As an ODM and Factory, we tailor thread profiles, coatings, and packaging to meet your project specs. I focus on consistent dimensions, heat-treated steel, zinc plating or stainless options, and stable supply chains. Our m3 self tapping nut features sharp threads and a driving shoulder to prevent stripping, enabling reliable joint strength in electronics, automotive, or appliance applications. We offer MOQ flexibility, rapid prototyping, and in-house QA to ensure tolerances +/- 0.05 mm. You tell me your material, thickness and finish, I’ll propose cost-efficient tooling and production plans. We ship worldwide, with traceable lot codes and packaging formats that fit your assembly line. Partner with us to simplify sourcing and speed up production for your next ODM project or Factory run. Let’s discuss your specs today.

Hot Selling Product

m3 self tapping nut Sets the Industry Standard Factory-Direct Excellence

Global buyers seek reliable, cost-efficient fasteners, and the M3 self-tapping nut set delivers. Designed for secure thread formation in thin metals, it offers consistent torque, corrosion resistance, and durable coatings across enclosures and panels. Factory-direct production enables tighter material control, precision stamping, and coating uniformity, reducing rejects and shortening lead times. A rigorous quality program—material checks, in-process inspections, and final torque tests—ensures traceability and predictable performance in every batch. For international projects, advantages include flexible quantities and customization (finishes, plating, thickness, thread size) with scalable production. Direct-from-manufacturer sourcing cuts distributor premiums and allows faster price updates. Reliable packaging, regional logistics, and on-time delivery protect schedules. A dedicated producer in a major global manufacturing hub offers a resilient, end-to-end supply chain that aligns quality with value and speed for diverse specifications.

m3 self tapping nut Sets the Industry Standard Factory-Direct Excellence
Variant Material Finish Thread Size Pitch (mm) Nut Style Hole Diameter (mm) Nominal Thickness (mm) Max Torque (N·m) Tensile Strength (MPa) Operating Temperature (C) Standards / Certifications Application
A1 Carbon Steel Zinc Plated M3 0.5 Self-Tapping 2.50 1.0 0.35 420 -40 to 120 ISO 9001, RoHS General electronics and automotive interiors
A2 Stainless Steel (A2-70) Passive Oxide M3 0.5 Self-Tapping 2.55 1.2 0.32 520 -60 to 250 ISO 9001, RoHS, REACH Corrosion-resistant assemblies
A3 Aluminum Alloy Anodized M3 0.5 Self-Tapping 2.40 0.9 0.22 270 -40 to 150 ISO 9001 Lightweight enclosures
A4 Carbon Steel Black Oxide M3 0.5 Self-Tapping 2.58 1.1 0.28 410 -40 to 120 ISO 9001 Durable automotive panels
A5 Stainless Steel (316) Bright Nickel M3 0.5 Self-Tapping 2.60 1.3 0.40 600 -55 to 260 ISO 9001, RoHS, REACH Marine and chemical environments
A6 Brass Nickel Plated M3 0.5 Self-Tapping 2.45 0.8 0.18 250 -20 to 120 ISO 9001 Decorative and specialty fastenings

Related Products

banner (4)

m3 self tapping nut Where Service Meets Innovation From Concept to Delivery

Data Dimension: Monthly Production Throughput (Units)

Line chart showing monthly production throughput (units per month) over a year. Jan Feb Mar Apr May Jun Jul Aug Sep Oct Nov Dec Months Units

Explanation: This visualization presents a data dimension of monthly production throughput measured in units per month on a single manufacturing line. The dataset spans twelve consecutive months and is designed to highlight trend, seasonality, and the effects of capacity changes on delivery performance. The x-axis represents calendar months from January to December, while the y-axis shows units produced, scaled to provide a consistent visual comparison. The line illustrates how throughput evolves as the production system optimizes for efficiency, balances workload, and responds to demand shifts. The general upward trend from the starting level around 120 units to roughly 260 units by year end indicates healthy growth and improved line utilization. Notable inflection points occur where the slope increases (early spring, autumn) and where short-lived declines appear (late spring). These variations often reflect real-world dynamics such as preventive maintenance, changeovers, supplier delays, or ramp-ups in production runs to meet backlog. The data are deliberately presented as a single metric to emphasize high-level performance; however, in practice, analysts would enrich this view with related metrics such as cycle time, defect rate, uptime, and changeover frequency to diagnose underlying causes of change.

Interpretation and usage: The visualization supports quick decision making by providing a clear map of throughput performance over time. For operations teams, the chart can prompt scheduling adjustments to avoid peak constraint periods and plan capacity expansions accordingly. For product teams, the trend may signal when changes to design or process require additional process capability. For executives, the line communicates whether the factory is scaling as intended and whether delivery commitments are attainable given current throughput. The chart can be extended with interactive features to compare multiple lines, overlay targets, or annotate events like maintenance windows or policy changes. Limitations include the absence of concurrent metrics such as yield, downtime, or material quality, which can all influence throughput independently. Future work could incorporate a dual-axis chart showing throughput alongside cycle-time or Overall Equipment Effectiveness (OEE) metrics, enabling a fuller view of where to invest to maximize throughput while preserving quality.

Top Selling Products