banner (1)

Low Head Shoulder Bolt - Custom Solutions for Factories

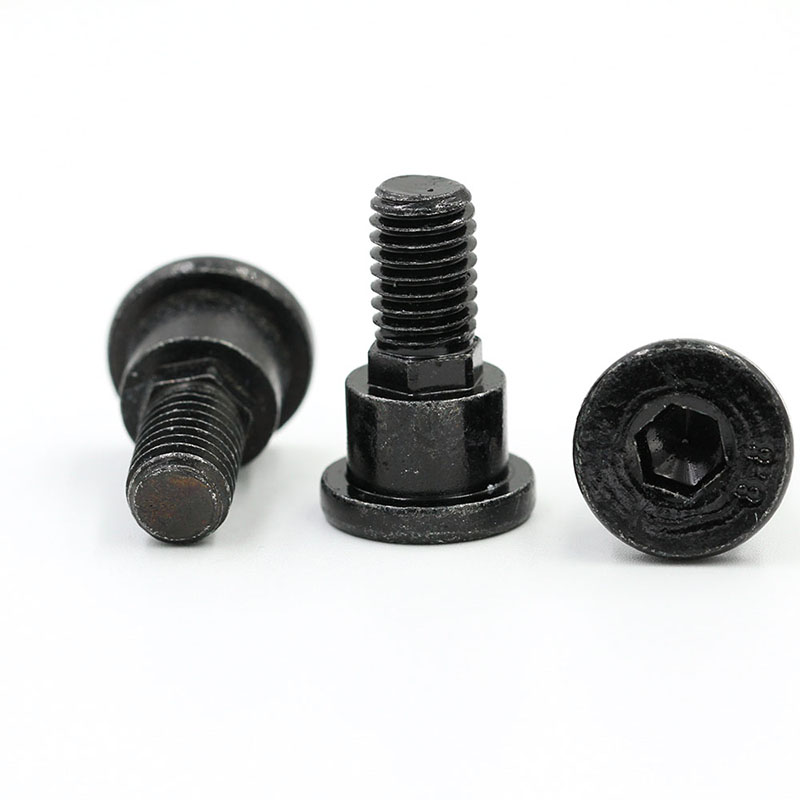
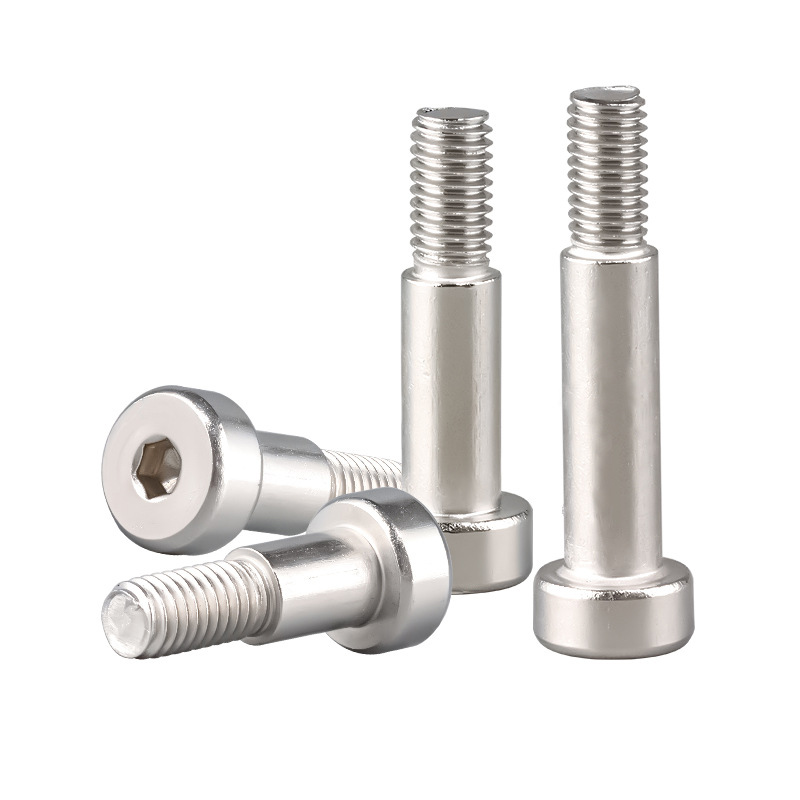
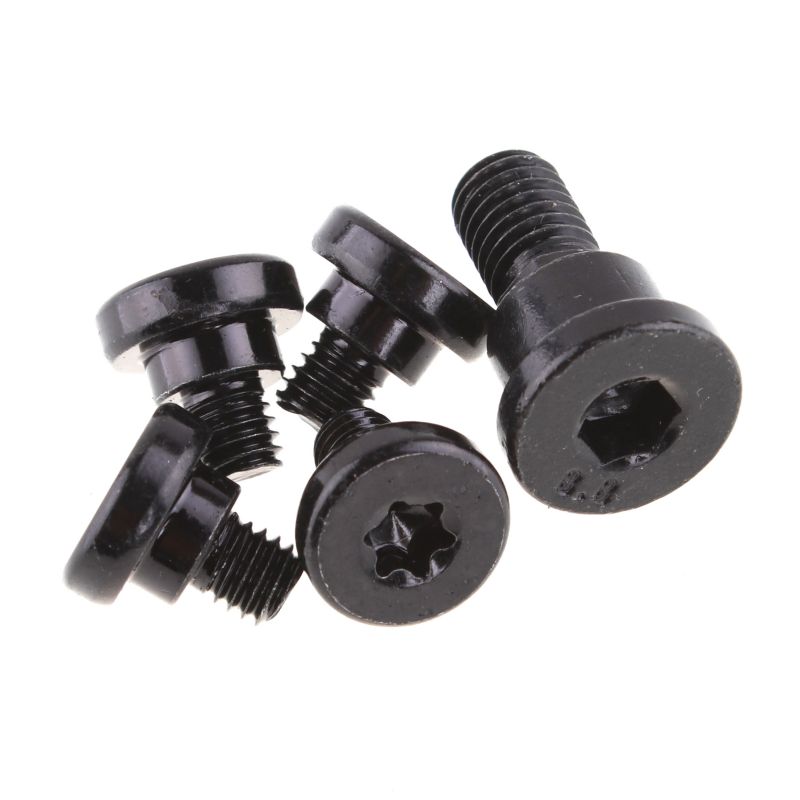
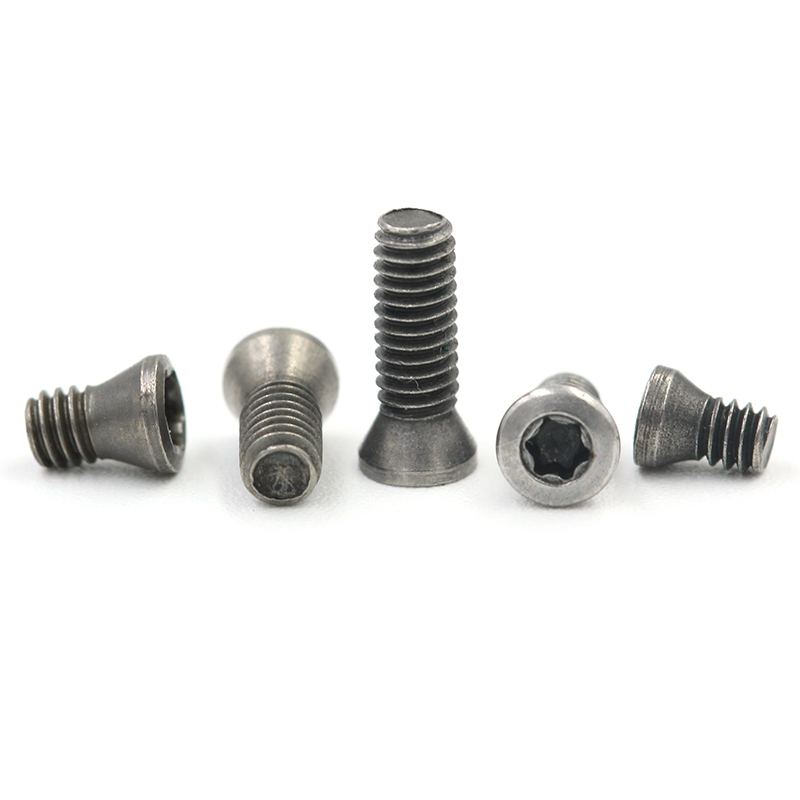
From my workshop to your factory, I supply low head shoulder bolts that meet demanding assembly lines. I focus on Custom solutions for Factories, tailoring size, finish, and material to your spec. The low head shoulder bolt I offer features a low-profile head for tight spaces, a precise shoulder for alignment, and strong grip with metric or imperial threads. We provide options in stainless steel, alloy steel, or heat-treated variants, with tight ISO tolerances. Custom finishes such as black oxide, zinc, or passivation are available. I can also supply forged or machined versions, with short lead times and strict QC at every stage. If your project needs a Custom bolt for automated lines, I work with you to choose the right length, diameter, shoulder length, and thread pitch. My aim is to speed up procurement for Factories and ensure reliable performance under vibration and load.

Hot Selling Product

low head shoulder bolt Sets the Industry Standard More Than a Supplier - A Partner

For global procurement teams, a low head shoulder bolt is more than a fastener; it is a standard of precision and reliability. Tight shoulder tolerances, a flush head, and robust material options ensure consistent fit and smooth automation across diverse supply chains. With rigorous testing and traceable material data, this component becomes a dependable backbone for electronics, machinery, automotive, and consumer products, helping minimize downtime and quality risks in global operations. Choosing a partner, not just a supplier, turns excellence into a scalable advantage. The right partner offers clear specifications, customization options, predictable lead times, and transparent logistics. From material selection and surface finishing to packaging and after-sales support, a collaborative approach reduces total cost of ownership and speeds time-to-market for buyers around the world.

{ low head shoulder bolt Sets the Industry Standard More Than a Supplier - A Partner}
Part ID Category Material Finish Head Style Shoulder Ø (mm) Shoulder Length (mm) Thread Ø Thread Pitch (mm) Overall Length (mm) Tensile Strength (MPa) Standards/Compliance Applications
SHB-1001 Shoulder Bolt Stainless Steel 316 (AISI 316) Passivated Button Head 12 22 M8 1.25 50 520 ISO 3506-1 Precision gear housing, alignment fixtures
SHB-1002 Shoulder Bolt Alloy Steel Black Oxide Cylindrical 10 20 M6 1.0 40 850 ISO 898-1 Grade 10.9 Automotive linkage, timing components
SHB-1003 Shoulder Bolt Aluminum Alloy 6061-T6 Anodized Button Head 8 18 M5 0.5 35 260 ISO 898-1 Grade 6.8 Light-weight assemblies, hobby instrument housings
SHB-1004 Shoulder Bolt Stainless Steel 304 Polished Button Head 14 28 M10 1.5 60 680 ISO 3506-1 Grade 304 High-load machinery, hydraulic assemblies
SHB-1005 Shoulder Bolt Titanium Grade 5 (Ti-6Al-4V) Natural Button Head 12 26 M8 1.25 45 900 ASTM F136 (Ti-6Al-4V) Aerospace-grade structural assemblies

Related Products

banner (3)

low head shoulder bolt Manufacturer Market Leader

Monthly Production Lead Time and On-Time Delivery Trend

Explanation: This visualization investigates a related data dimension: monthly production efficiency measured by two complementary metrics—lead time and on-time delivery rate. Lead time captures the number of days from order receipt to shipment, while on-time delivery rate expresses the percentage of orders delivered within the promised window. Presenting both series together helps reveal how responsiveness and reliability interact over time. The left y-axis shows lead time in days; the right y-axis shows delivery reliability, making it possible to observe potential trade-offs and synergies between speed and accuracy. The period spans twelve months to illustrate seasonal patterns and process changes. In general, shorter lead times tend to align with higher on-time rates, but fluctuations occur due to demand surges, supplier constraints, or logistical disruptions. For example, months with a noticeable drop in lead time often coincide with improvements in delivery performance, suggesting better scheduling and capacity management. Conversely, if lead times rise while on-time delivery remains high, it may reflect buffering strategies or prioritization that protects timely delivery. The data come from production scheduling, warehousing, and shipping records, with timestamps aligned to calendar months. Before visualization, data cleaning steps include handling missing values, normalizing units, and smoothing extreme outliers that could distort trends. Stakeholders can use this view to identify periods that warrant deeper investigation—such as cross-functional reviews of procurement, production planning, and logistics—to determine whether issues are systemic or transient. The chart also serves as a baseline for evaluating the impact of process improvements, automation, or capacity investments. Limitations include potential lag between operational changes and observable effects, and the fact that only two metrics are shown. Future work could layer additional indicators such as inventory levels, defect rates, and capacity utilization to provide richer context for decision-making. Overall, this visualization supports data-driven decisions aimed at balancing speed, reliability, and efficiency in the production and supply chain.

Top Selling Products