

Custom Countersunk Raised Head Self-Tapping Screws for Factories
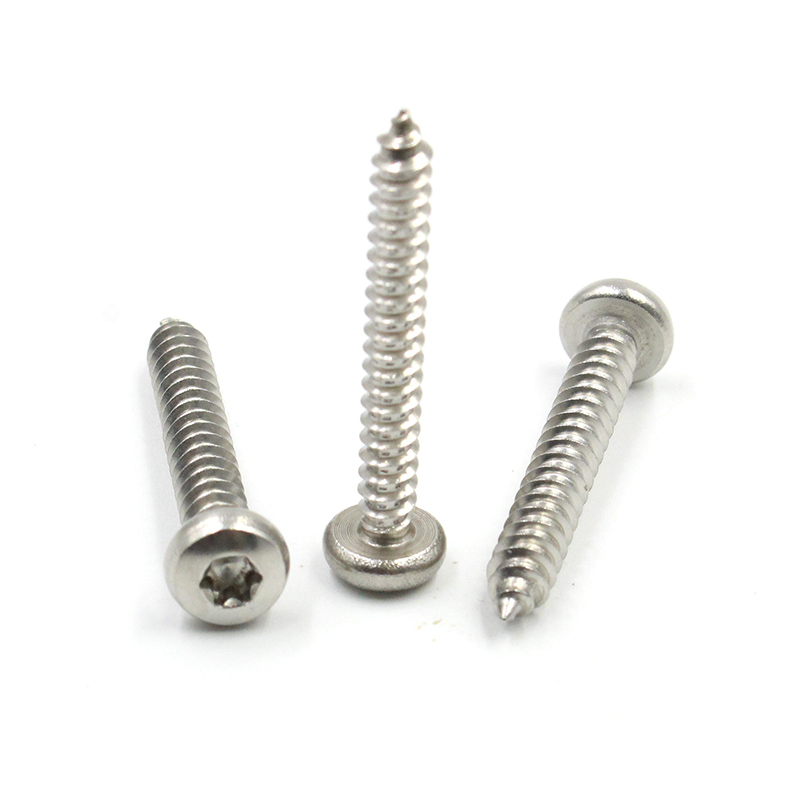
I help buyers like you secure reliable fasteners, focusing on countersunk raised head self-tapping screws for clean, secure assemblies. I work with Factories around the world and know timing, tolerance, and traceability matter. I offer Custom options: adjustable lengths, head styles, coatings, and drive types to fit your exact application. For you, as a customer with Custom projects and large-scale production, I deliver consistent quality at competitive prices. My factory-grade control means tight tolerances, material verification, and rigorous QA before every shipment. I stock stainless steel, carbon steel, and coated variants to handle corrosive or demanding environments. MOQs are sensible and scalable, and lead times are transparent with reliable logistics partners. From quote to delivery, I keep things simple and transparent, ensuring the countersunk raised head self-tapping screws you need go straight to your line with minimal fuss.

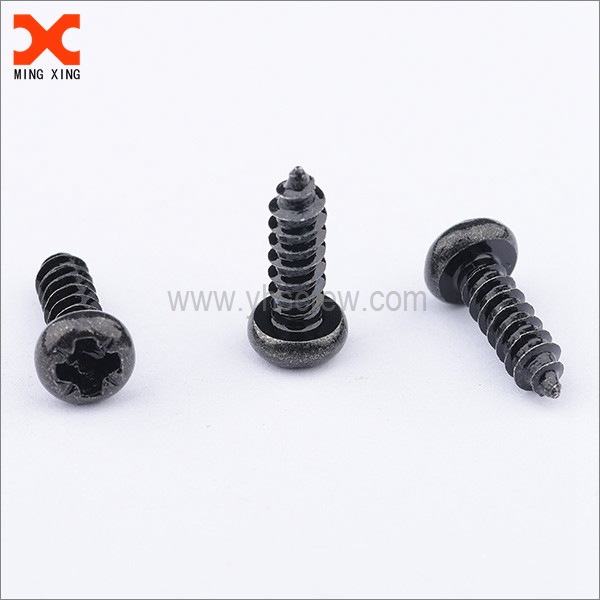
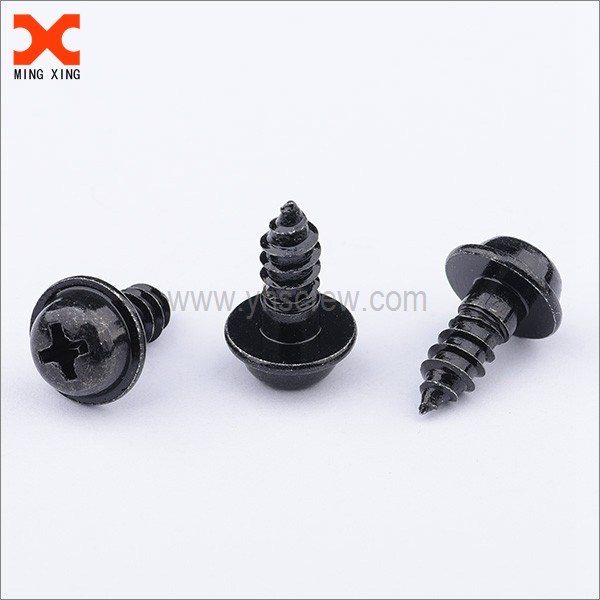
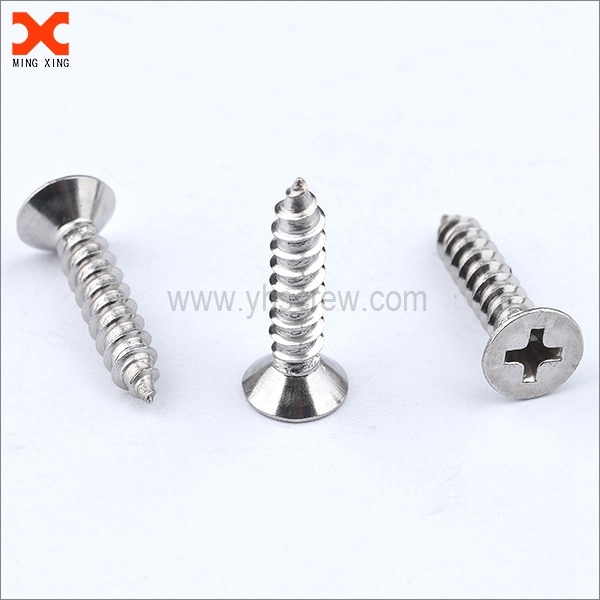


countersunk raised head self-tapping screws in 2025 More Than a Supplier - A Partner
In 2025, countersunk raised head self-tapping screws are more than components—they are connectors between design intent and production reality. Global buyers increasingly seek a partner who understands performance, supply risk, and total cost of ownership, from prototyping to end-of-life support. Choose material options (stainless, alloy, or coated variants), head geometry for flush assembly, and thread forms tuned for your base material. Expect rigorous process controls, dimensional checks, and functional tests (pull-out, torque, corrosion) with full lot traceability. Flexible lead times, safety stock, and local representation help stabilize global supply chains. Beyond parts, a true partner assists in design-for-manufacture, provides value-added services like packaging and labeling, and collaborates on lifecycle procurement. With shared risk and continuous improvement, buyers gain predictable delivery, faster time-to-market, and sustainable compliance across industries and regions.
| Code | Diameter (mm) | Length (mm) | Material | Finish | Head Type | Drive Type | Thread Type | Tensile Strength (MPa) | Salt Spray (hours) | Standards | Origin | Lead Time (days) | Applications |
|---|---|---|---|---|---|---|---|---|---|---|---|---|---|
| CSR-01 | 2.9 | 8 | Stainless steel A2 (304) | Zinc plated | Raised countersunk | Phillips #2 | Partially threaded | 520 | 720 | DIN EN ISO 3506; RoHS | China | 7 | Automotive body panels |
| CSR-02 | 3.5 | 12 | Stainless steel A2 (304) | Nickel plated | Raised countersunk | Torx T20 | Fully threaded | 700 | 1000 | DIN EN ISO 3506; RoHS | China | 14 | Electrical enclosures, general metal assemblies |
| CSR-03 | 4.2 | 16 | Alloy steel | Black oxide | Raised countersunk | Phillips #2 | Partially threaded | 800 | 1000 | DIN EN ISO 14592; RoHS | Germany | 10 | HVAC ducts, appliance housings |
| CSR-04 | 5.0 | 20 | Alloy steel | Zinc plated | Raised countersunk | Torx T25 | Fully threaded | 600 | 720 | ISO 9001; RoHS | Japan | 21 | Furniture metal frames |
| CSR-05 | 6.3 | 25 | Stainless steel A2 (304) | Zinc plated | Raised countersunk | Torx T25 | Partially threaded | 540 | 480 | DIN EN ISO 3506; RoHS | USA | 30 | Industrial machinery panels |
| CSR-06 | 8.0 | 30 | Stainless steel A4 (316) | Passivated | Raised countersunk | Torx T30 | Fully threaded | 900 | 1000 | ISO 3506; RoHS | Italy | 12 | Marine equipment components |
Related Products
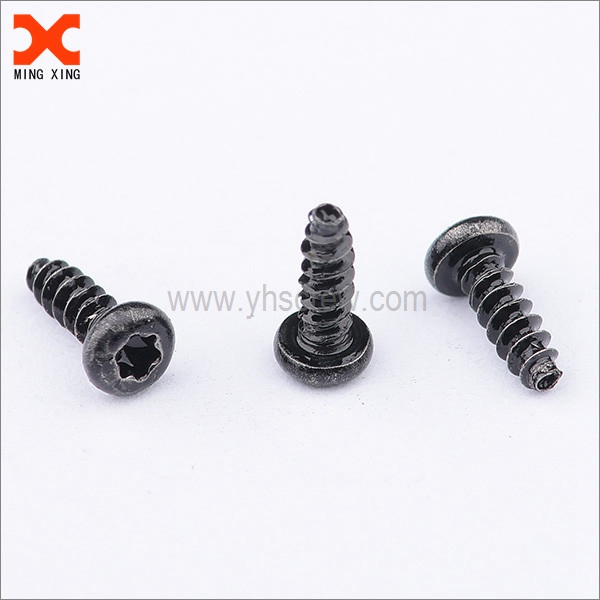



countersunk raised head self-tapping screws Dominates Exceeds Industry Benchmarks
Top Selling Products

- Related Blog
- Reviews
- Reviews

-

Phone
-

E-mail
-

Whatsapp
-

WeChat

-

Top


