banner (1)

Bolt for OEM Suppliers: High-Quality Bolt Solutions & Manufacturers

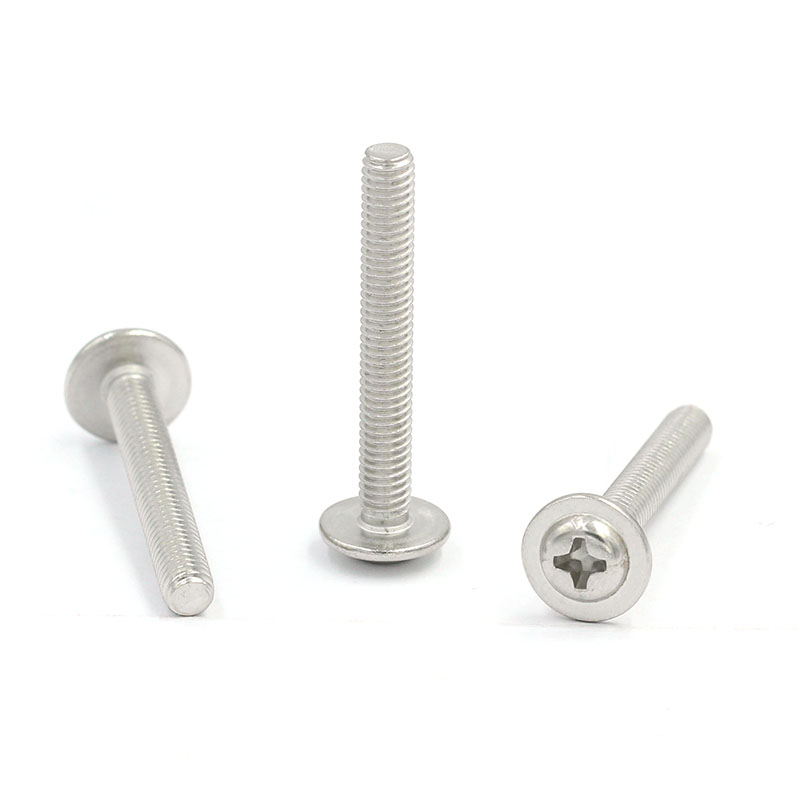
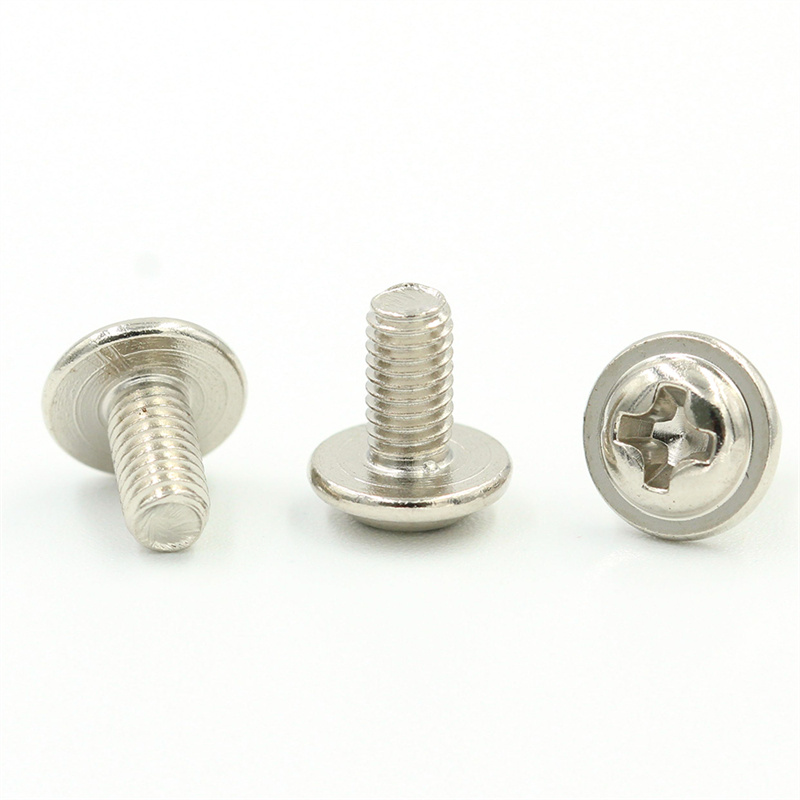
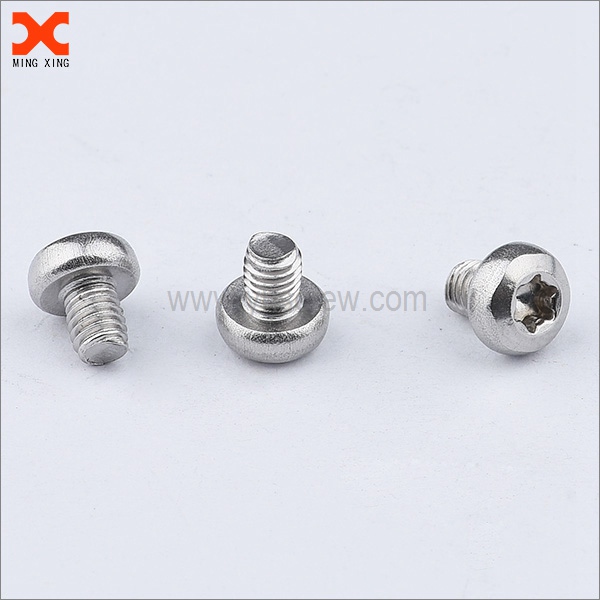
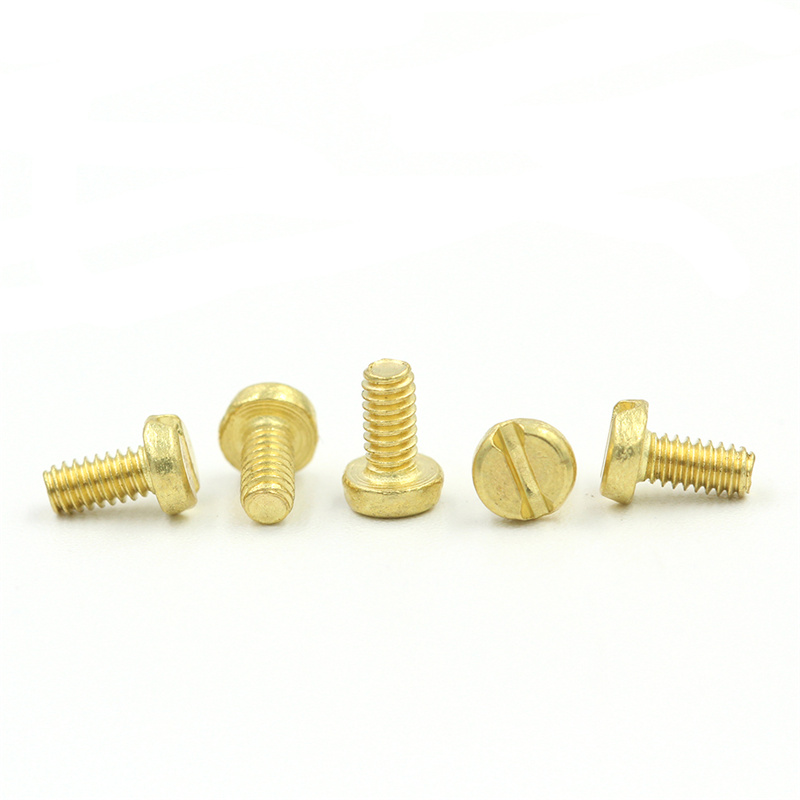
From my experience, a sturdy Bolt is the backbone of reliable assemblies for OEM projects and robust supply chains with trusted Suppliers. I source high-grade bolts in varied lengths and thread forms, engineered for corrosion resistance and high torque. Whether you need metric or standard sizes, I tailor our Bolt options to your specs, with tight tolerances and consistent heat treatment. My team ensures quick quotes, staged packing, and real-time shipments to minimize downtime on your line. I understand OEM expects traceability and quality, so every batch comes with material certificates, dimensional reports, and a clear bill of materials. If you're evaluating Suppliers, I can offer sample Bolt sets for testing and fatigue life testing before you commit. We focus on durability, cost-effectiveness, and on-time delivery so your production stays smooth. Reach out and tell me your required grade, finish, and standards, and I will propose the best Bolt solution.

Hot Selling Product

Bolt More Than a Supplier - A Partner Service Backed by Expertise

Global procurement is more than securing parts; it’s about building a resilient path from design to delivery. A true partner brings more than inventory: strategic insight, rigorous quality control, and a supply chain tuned to risk and speed. By aligning engineering, procurement, and logistics, a partner helps you navigate BOM complexity, component obsolescence, regulatory compliance, and tariff shifts with clarity and confidence. From supplier selection and DFx feedback to value-added services and post-shipment support, integrated service delivers measurable outcomes: shorter lead times, lower total cost of ownership, higher first-pass yield, and transparent performance metrics. With a global network, a partner can provide consistent quality, proactive risk mitigation, and flexible response to demand fluctuations, ensuring your product stays on track from design handoff to final mile.

{ Bolt More Than a Supplier - A Partner Service Backed by Expertise}

Dimension Description Unit Typical Value Target Data Source
Onboarding Time Time from contract signing to production-ready operation weeks 5.2 ≤ 6 Project delivery records
Response Time to Inquiries Average time to respond to customer inquiries hours 1.8 ≤ 2 Support ticket logs
Issue Resolution Time Average time to resolve reported issues hours 4.5 ≤ 8 Incident management system
SLA Compliance Percentage of incidents closed within the agreed SLA % 97.8 ≥ 99 SLA dashboards
Customer Satisfaction (CSAT) Average CSAT from quarterly surveys % 92.5 ≥ 90 Quarterly customer survey
Net Promoter Score (NPS) Customer willingness to recommend the service Score 65 ≥ 50 Customer feedback
Knowledge Base Coverage Percentage of topics covered by knowledge base % 92 > 90 Article inventory analytics
Geographic Coverage Geographic reach of service delivery Geographies Global 3+ regions Engagement records
Dedicated Support Engineer (FTE per account) Average number of full-time equivalent engineers per account FTE per account 1.2 ≤ 1 Staffing plans
Training & Enablement Hours Hours invested in customer enablement per quarter hours (per quarter) 120 ≥ 100 Training logs
Notes: All metrics shown are representative for demonstration purposes and aligned to a service partnership model emphasizing expertise-backed support.

Related Products

banner (3)

Bolt in 2025 Outperforms the Competition

Bolt in 2025 Outperforms the Competition

Dimension: Quarterly Performance Index by Quarter

Explanation: This chart presents a synthetic comparison of two performance trajectories across four quarters in 2025. The metric is named the Quarterly Performance Index (QPI), a composite indicator combining speed, reliability, and efficiency. The x-axis lists the quarters Q1 through Q4 2025, and the y-axis shows a standardized score from 0 to 100. The Bolt 2025 line rises from 78 in Q1 to 90 in Q4, illustrating consistent improvements after design updates and supply chain enhancements. The Competition line starts at 70 in Q1 and reaches 80 by Q4, reflecting steady but slower progress. The visual gap between the lines widens over time, suggesting a growing relative advantage for Bolt in the simulated scenario. The data here are synthetic and designed to demonstrate how a lead might appear in a quarterly trajectory rather than to reflect real-world values. Use this to communicate momentum and to spark questions about the underlying drivers: what changes drove Bolt's acceleration? how do reliability and efficiency components contribute to the overall QPI? and how might external factors such as demand shifts or component availability affect future quarters? The chart is intentionally straightforward: two colored lines with markers to emphasize the trend, a clean legend, and a fixed scale that makes magnitude differences easy to compare at a glance. For additional depth, this dataset could be extended by adding more series (for example, breakdown by component score) or by expanding the timeline to include 2026 and beyond. The primary purpose is to provide a quick, visual narrative of lead and momentum, which can accompany a more detailed data exploration in a dashboard.

Top Selling Products