banner (1)

Bolt Security Screws - China Manufacturer for Quality & Reliability

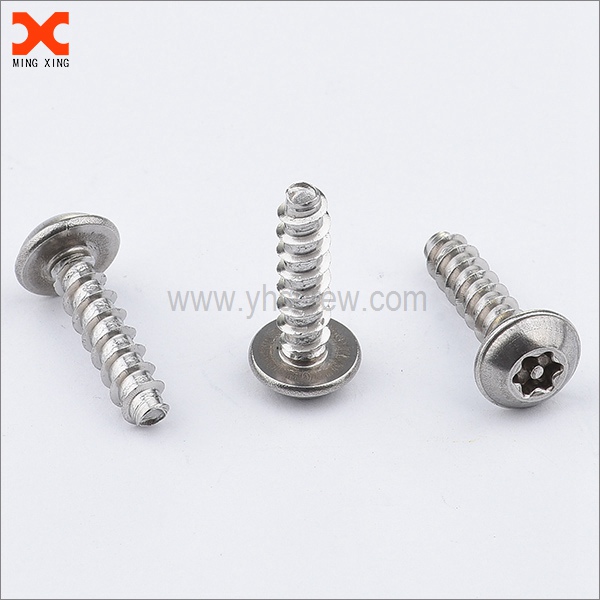
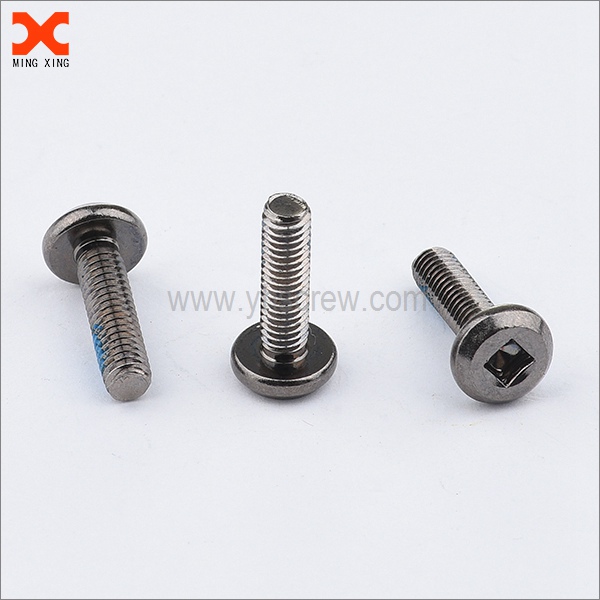
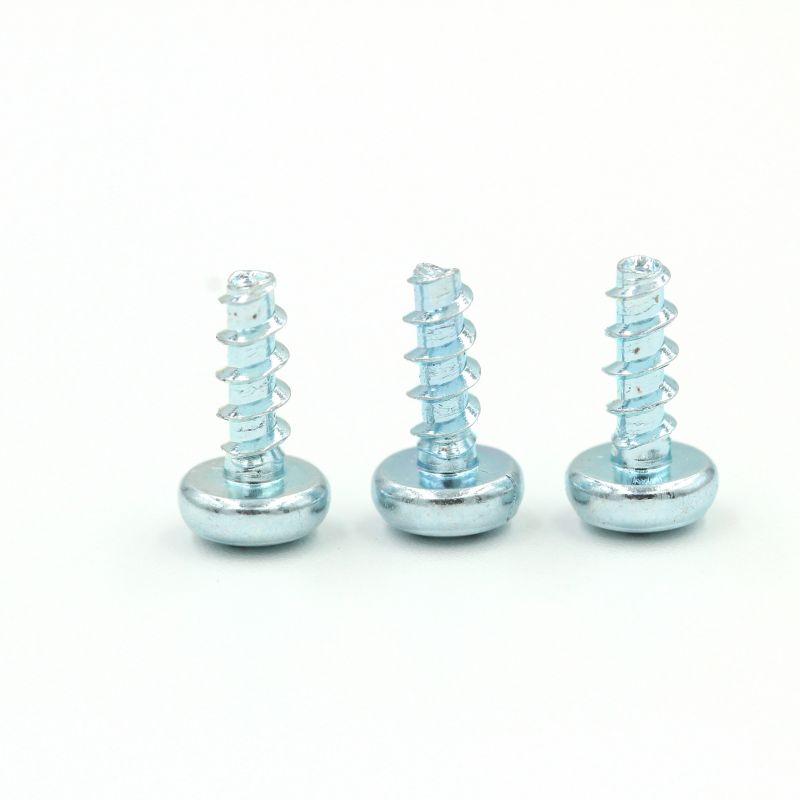
I’m a procurement specialist from a China-based Manufacturer, and I know how critical secure fasteners are for industrial projects. Our bolt security screws deliver tamper-resistant performance, with hardened steel bodies and anti-drill heads. We offer metric and inch sizes, compatible with common security patterns, including spanner and pin-in-head configurations. I can guarantee precision threading, consistent torque resistance, and corrosion protection with zinc, nickel, or black oxide finishes. For B2B buyers, I provide fast lead times, MOQs adapted to project scale, and compliant material certificates (ROHS, REACH). We ship worldwide from China to global customers, with strong QA at every stage. If you want reliable security screws to deter tampering and minimize maintenance costs, our bolt security screws are the right choice for your manufacturing line, OEMs, or construction projects. Contact me to discuss volume pricing and customized packaging.

Hot Selling Product

bolt security screws Your End-to-End Solution From Concept to Delivery

Bolt security screws — your end-to-end solution from concept to delivery. For global buyers, an integrated approach covers design, material selection, and form optimization for tamper resistance and efficient assembly. Whether you need one-way screws, security Torx, or pin-in drives across electronics housings, automotive enclosures, or industrial equipment, the right specification saves time and preserves integrity. Early collaboration ensures tolerances, corrosion protection, and coatings meet RoHS/REACH standards while enabling miniaturization. From prototype to delivery, this solution combines precision manufacturing, rigorous QA, and reliable logistics. With processes like forging or cold extrusion, heat treatment, and accurate threading, we guarantee consistent performance. Every lot is traceable and inspected to critical dimensions to prevent field failures. Flexible MOQs, compliant packaging, and clear lead times help procurement plan globally. Optional services such as labeling, kit assembly, and after-sales support complete the package.

{ bolt security screws Your End-to-End Solution From Concept to Delivery}
Stage Deliverable Lead Time (weeks) Key Metrics Validation Method Outcome
Concept & Requirements Concept brief; initial BOM concept 1.5 Stakeholder satisfaction: 92% Requirements traceability matrix; reviews Approved concept
Design & Prototyping CAD model; prototype 3 Fit accuracy: 0.05 mm; Mouldability verified FEA; physical tests Prototype validated
Process Development Manufacturing process plan 2 Process yield: 98%; Cycle time: 12 s Pilot run; process capability analyses Process validated
Supplier & QA Readiness Approved supplier list; QA plan 1 Supplier defect rate: 0.3%; PPAP readiness Audit; PPAP Suppliers approved
Pilot Production Pilot batch 2 First-pass yield: 97%; Dimensional tolerance Dimensional inspection; Functional test Pilot cleared
Full-Scale Production Serial production; Documentation 4 On-time delivery: 99%; Scrap rate: 0.2% SPC; ISO audits Ready for delivery
End-to-End Performance Metrics dashboard 0 (ongoing) Total cycle time; Defect rate; Customer satisfaction Monthly review Continuous improvement
Compliance & Sustainability Compliance report; eco-friendly materials 1 Material usage; Recyclability; Regulatory approvals Audit; Test reports Compliance assured

Related Products

banner (4)

bolt security screws Pioneers in the Field From Concept to Delivery

New Data Dimension: Production Efficiency Trend

0 20 40 60 80 100 W1 W2 W3 W4 W5 W6 W7 W8 W9 W10 W11 W12

Explanation: The chart presents a longitudinal view of production efficiency across twelve periods. The data dimension here tracks a composite efficiency index, derived from throughput, downtime, and quality yield. Each point represents a discrete period, with values scaled from 0 to 100. The trend begins in the mid‑range and generally increases, with occasional dips that reflect events such as maintenance, supply delays, or tuning cycles. Early weeks show rapid gains as processes are standardized and the workforce becomes familiar with the new routines. Mid sequence data show sustained high performance with minor fluctuations, perhaps corresponding to line changes or calibration checks. In the latter weeks, values approach the upper end of the scale, indicating that capacity is being utilized efficiently while remaining within safe operating limits. The slope is steeper during the initial phase and gradually flattens, suggesting diminishing returns from incremental adjustments and signaling the possible need for a broader change, such as equipment upgrades or workflow redesign. The grid lines help contextualize performance relative to target bands: top at 100 denotes peak potential, while intermediate lines at 60 and 80 reflect solid and strong performance, respectively. Examining the twelve periods provides a clear sequence for tracking progression and spotting anomalies. From a managerial perspective, this visualization supports prioritizing actions that minimize downtime, improve line reliability, and sustain quality across cycles. Investments in preventive maintenance, real‑time monitoring, and operator training can elevate performance, but meaningful gains may require holistic process innovations and cross‑functional alignment. The dataset resembles a realistic learning curve in manufacturing, where early momentum yields meaningful improvements, yet later advancements demand more systematic changes. In sum, the chart communicates how efficiency evolves over time, highlighting growth, plateaus, and recovery periods, and providing a baseline for future optimization experiments to compare against. This approach promotes data‑driven decision making, fosters accountability, and enables scenario planning. By normalizing data across lines, teams can benchmark performance and propagate best practices across the organization.

Top Selling Products