banner (1)

Special Drive Screw: Cheap Prices & Pricelist

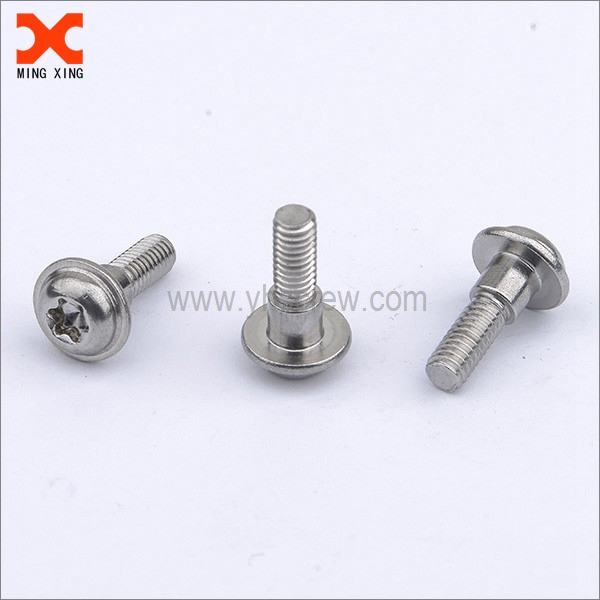
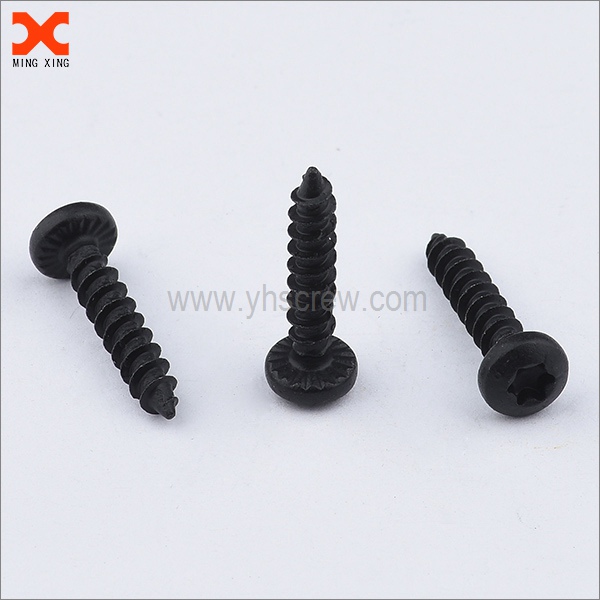
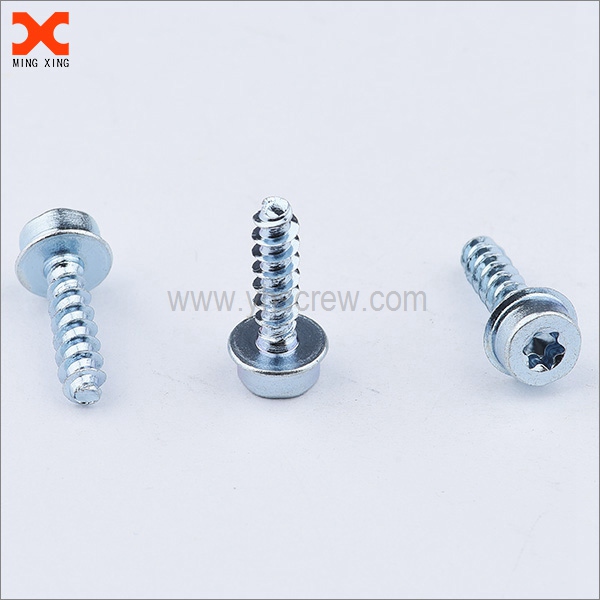
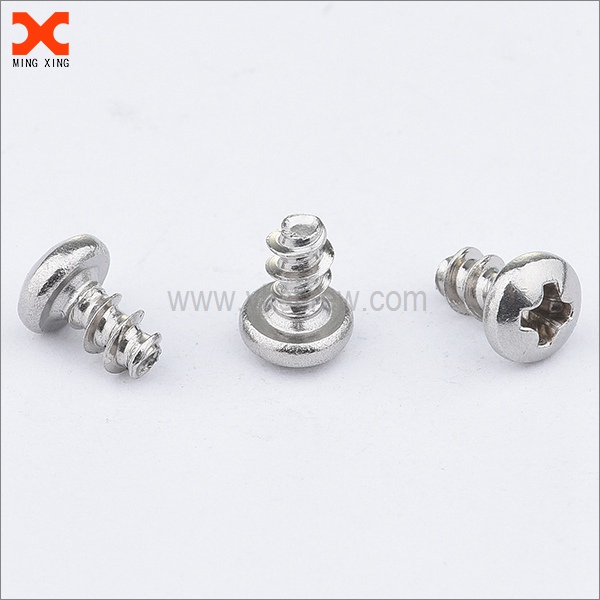
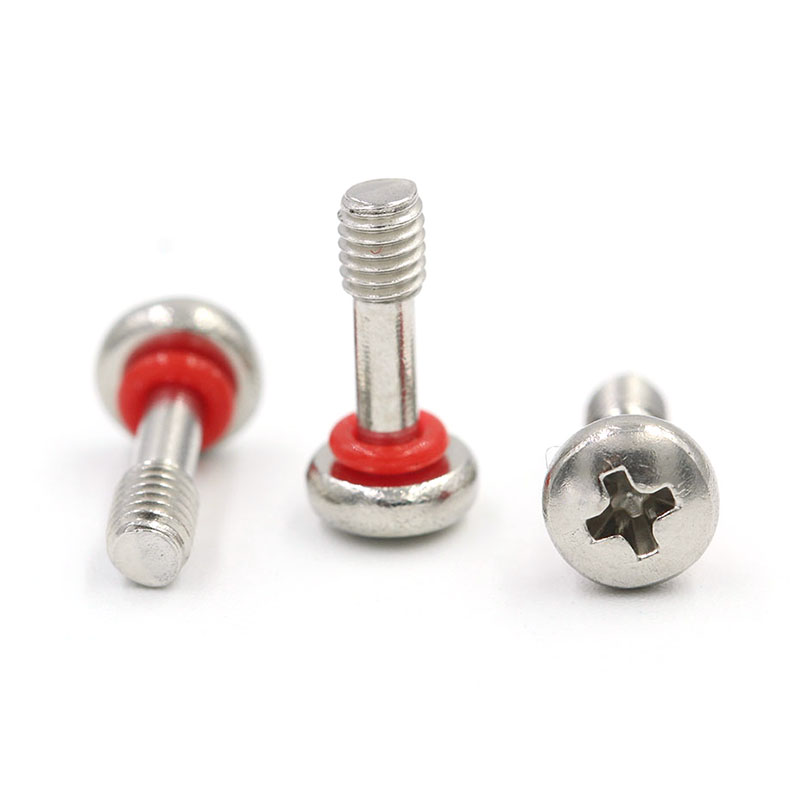
I supply a Special Drive Screw designed for high-load assemblies and precise torque control. With an anti-cam-out design and a corrosion-resistant coating, it keeps your line on schedule. Our screw features hardened steel and tight tolerances to minimize rework. For B2B buyers, I offer flexible MOQs, fast lead times, and a clear Pricelist to compare options. If you’re after cost savings without sacrificing performance, our cheap prices on bulk orders will help. Our team can tailor thread types, lengths, and head styles to fit your equipment. Every batch is quality checked before dispatch, ensuring consistent performance. Request a sample or formal quote, and I’ll share technical datasheets and the latest Pricelist. Let’s boost your assembly efficiency with the right Special Drive Screw.

Hot Selling Product

Special Drive Screw For the Current Year Sets the Industry Standard

This year’s Special Drive Screw has redefined the industry standard by delivering superior torque transfer and reduced cam-out, thanks to optimized engagement geometry and hardened, corrosion-resistant materials. Its drive interface supports common systems while maintaining compatibility across multi-vendor assemblies, reducing misfits in procurement. Enhanced surface treatments extend service life in high-vibration and harsh-temperature environments, lowering maintenance and downtime for diverse equipment fleets. For global buyers, the benefits are clear: consistent quality, batch traceability, and streamlined sourcing with fewer SKUs. Compliance with RoHS/REACH and standardized testing protocols ensure dependable performance across borders. Flexible packaging, scalable output, and rigorous torque and hardness checks shorten qualification cycles, enabling faster time-to-value while simplifying supplier qualification and integration into electronics, automotive, and industrial applications.

{ Special Drive Screw For the Current Year Sets the Industry Standard}
Part Number Drive Type Head Style Length (mm) Diameter (mm) Thread Pitch (mm) Material Finish/Coating Hardness (HRC) Tolerance Typical Applications Notes
DS-ATX-04 Torx Pan Head 25 4.0 0.75 Stainless Steel A2 Satin 50-54 +0.00/-0.10 Electronics Enclosures, Automotive Interior Assemblies Standard torque capability
DS-SS-06 Phillips Round Head 18 3.0 0.50 Stainless Steel 305 Bright Zinc 45-50 +0.0/-0.15 Consumer Electronics, Small Appliances RoHS compliant
DS-AL-08 Hex Socket Cap Head 50 5.0 0.80 Aluminum Alloy 6061 Anodized Black 35-40 +0.00/-0.15 Enclosures, Automotive Interiors Low weight option
DS-ST-10 Torx Pan Head 30 3.5 0.50 Stainless Steel A4 (316) Passivated 45-50 +0.00/-0.13 Medical Devices, Industrial Equipment Corrosion resistance
DS-DS-12 Torx Button Head 12 4.0 0.75 Stainless Steel A2 Zinc Plated 46-52 +0.00/-0.12 Consumer Electronics Assembly Visible-fastener style
DS-BR-07 Phillips Flat Head 14 2.5 0.45 Brass Electroplated 28-35 +0.00/-0.08 Furniture Assembly, Decorative Fixtures Machinable
DS-SS-09 Hex Drive Socket Cap 40 4.5 0.75 Stainless Steel A2 Black Oxide 44-52 +0.00/-0.15 Industrial Equipment, Machinery High-torque application

Related Products

banner (4)

Special Drive Screw Service Industry Leaders

Data Dimension: Lead Time by Service Type across Quarters

New Data Title: Lead Time Trend by Service Type

Explanation: This line chart presents a synthetic dataset for the drive screw service industry, illustrating how the average service lead time changes across four quarters for different service types. The chart title and the data dimension label emphasize that the primary metric is Lead Time (days) and the secondary category is Service Type. Each line represents a distinct service type: New Equipment Installation, Repairs, and Routine Maintenance. The x-axis shows quarterly periods Q1 through Q4, while the y-axis represents the number of days required to complete a service task. The objective is to reveal trends, seasonality, and potential capacity constraints that influence turnaround times.

From the plotted values, several observations can be made. Repairs consistently register higher lead times than Routine Maintenance, suggesting more complex logistics, parts sourcing needs, or synchronization with client availability. New Equipment installations fluctuate more visibly, reflecting project-driven demand that can strain scheduling when several big installations occur in a single quarter. Routine Maintenance remains the most stable line, indicating a more predictable workflow, but still demonstrates occasional spikes. Overall, the chart can help managers identify where to target efficiency improvements, such as standardizing repair workflows, stocking critical parts, or increasing technician coverage during peak quarters.

The data dimension approach—combining time (quarters) with service category—enables cross-sectional comparisons at a glance. It supports scenario analysis: if a future initiative reduces the Repairs lead time by two days across all quarters, the chart would immediately show convergence with Routine Maintenance and a potential overall reduction in average lead times. The visualization is intentionally simple for clarity, but it can be extended with confidence bands, moving averages, or annotation marks for anomalies. When integrated into a broader dashboard with ticket volumes and resource availability, it becomes a powerful tool for operational planning and strategic decision-making. Note that this dataset is synthetic and meant for illustrative purposes.

Top Selling Products